Web: August 2 | 2026

Hello,

Stay up to date with the latest features and enhancements we’ve just launched on the Dynamox Platform.

Check out what’s new and leverage these updates to their fullest! 


Mass Asset Configuration 

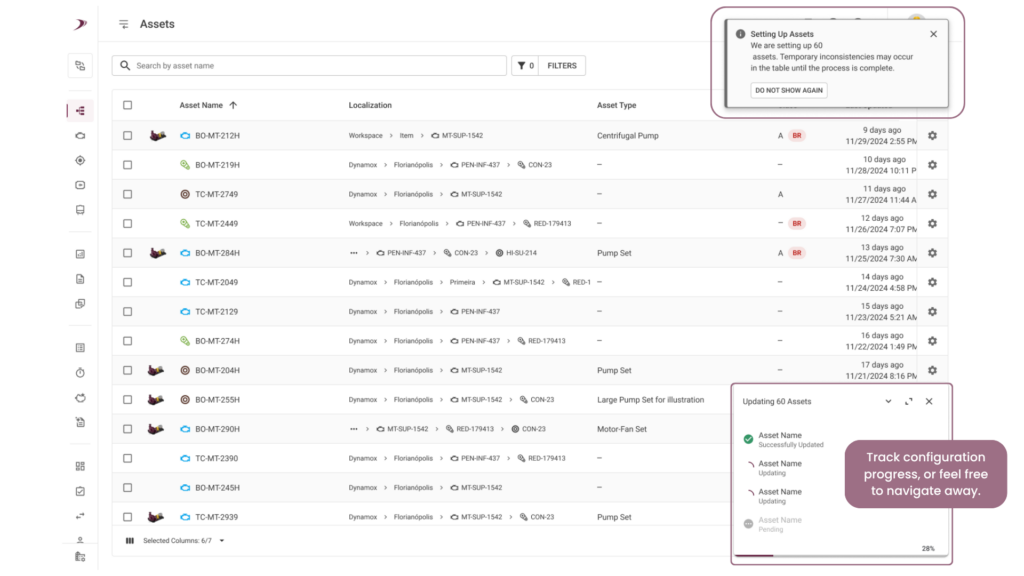
Previously, defining type, manufacturer, model, risk class, and business risk required opening one asset at a time. At scale, configuring thousands of assets was unfeasible. 

To streamline this, we have released Mass Asset Configuration, now available on the new Assets page. 

Why it matters 

Type and risk classification are not just registration fields. They drive coherent asset prioritization and the reliability of platform insights. Untyped assets participate less in analysis, meaning a configuration gap can quickly become a diagnostic gap. 

What changes in practice 

  • Scale — up to 1,000 assets per operation in a single run. 
  • Standardization — similar assets no longer diverge due to manual entry differences. 
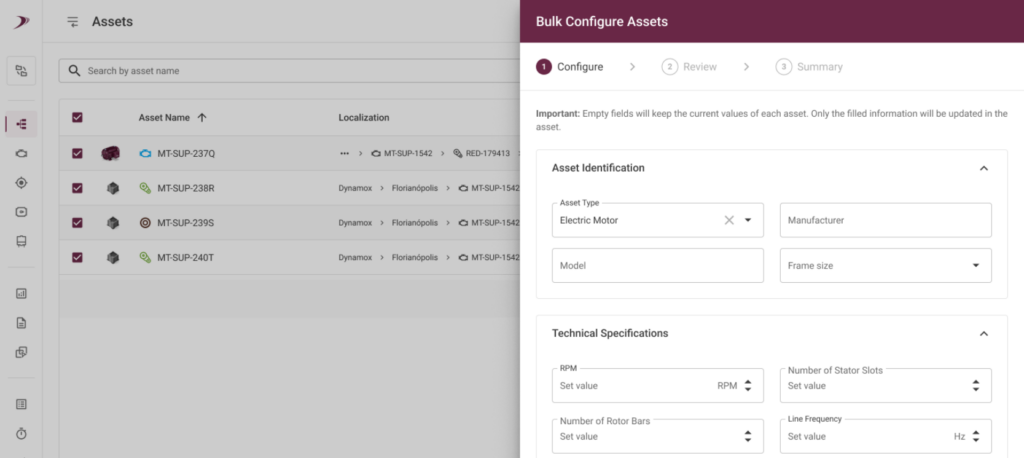
  • Depth — when a type has specific technical characteristics, they are included in the bulk update. Example: Selected an electric motor? Configure the number of rotor bars and stator slots for all of them at once. 
  • Reliability — each asset is processed individually. If one fails, the others proceed, allowing you to retry only the pending ones. 

How to use it 

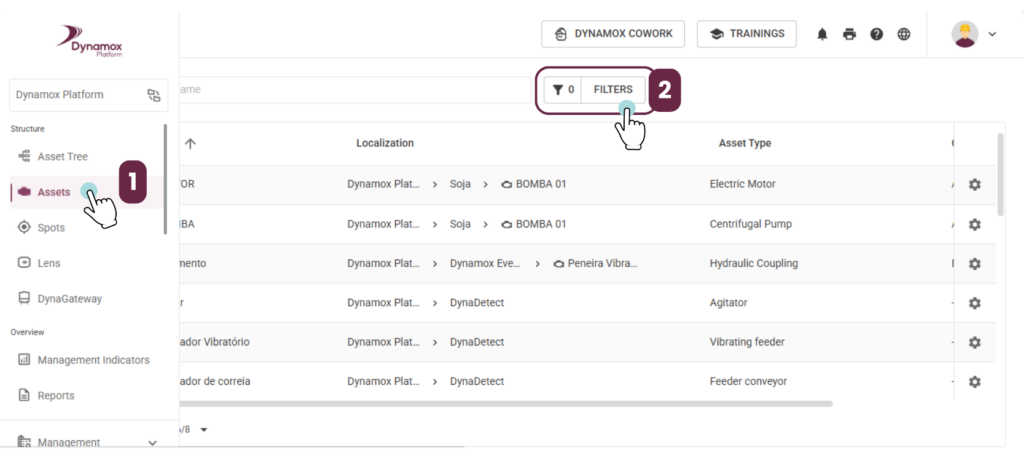
  1. In Assets, filter what you want to configure. Filter by “no type” to spot exact gaps, or search by name.

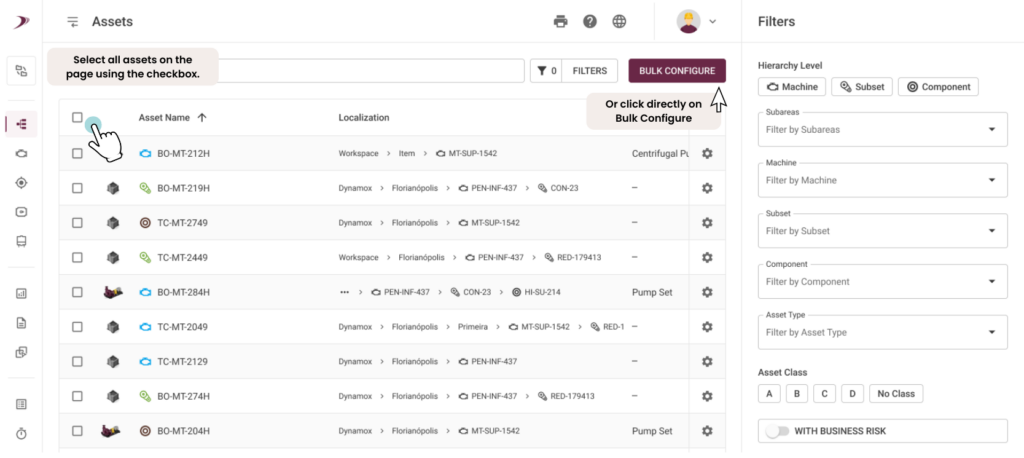
2. Select the assets or go directly to Mass Configuration (the first 1,000 are automatically selected). 

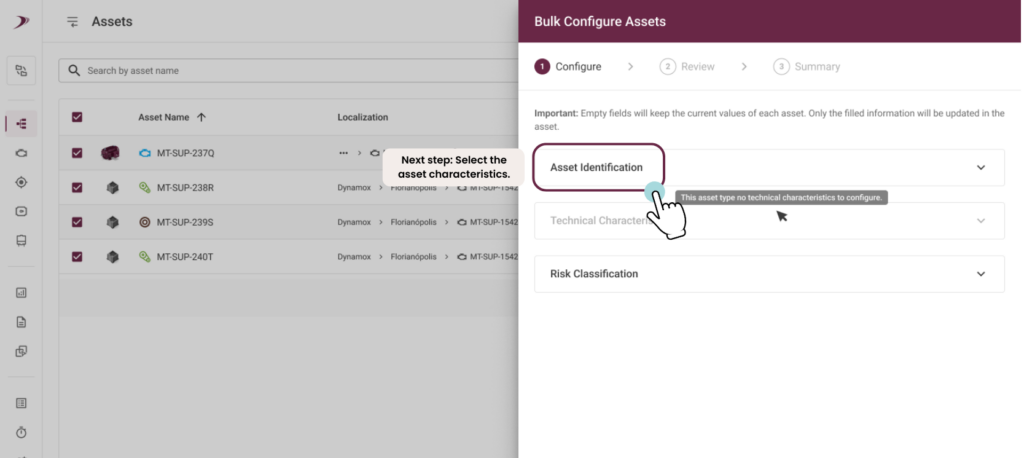
3.Define the batch data: identification, technical characteristics, and risk classification. 

4.Fill in the details, review the summary, and confirm. 

5. Once saved, you can move on to the next batch. 

Best time-saving practice: group only assets with the same configuration goal. A purpose-driven batch yields better results than a large, mixed one.

Why is this update important? 

In the new Decision Making Assistant (DMA), the GUT matrix prioritizes your assets and pinpoints where maintenance should act first. To leverage this prioritization, assets must be correctly classified with populated criticality, business risk, and other attributes. 

Configuring this data ensures the platform receives the necessary inputs, empowering you to unlock the full potential of GUT prioritization. 

Previously, entering this data meant opening one asset at a time. Now, you can classify dozens of assets in a single batch operation. 

The result: less manual work, a streamlined environment setup, and a consistent foundation for the GUT matrix to deliver more accurate prioritizations. 


PDF Reports and Image Downloads in Thermal Viewer 

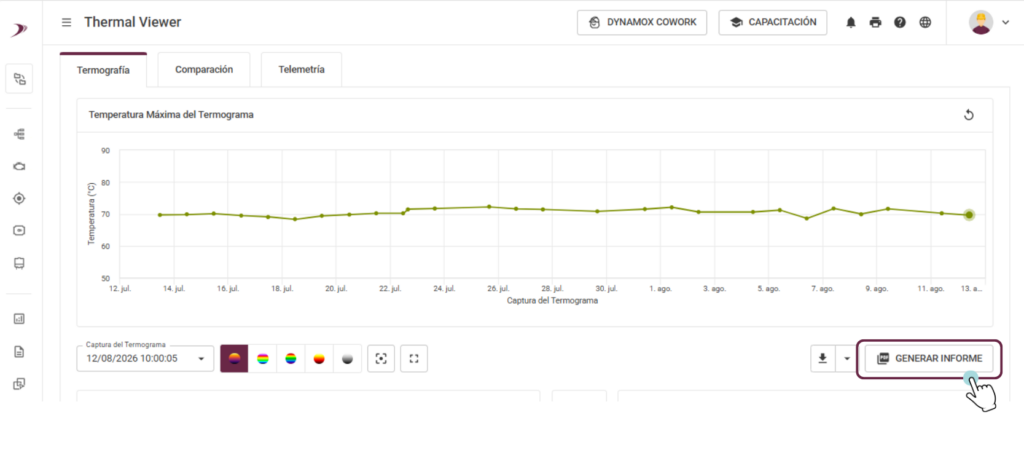
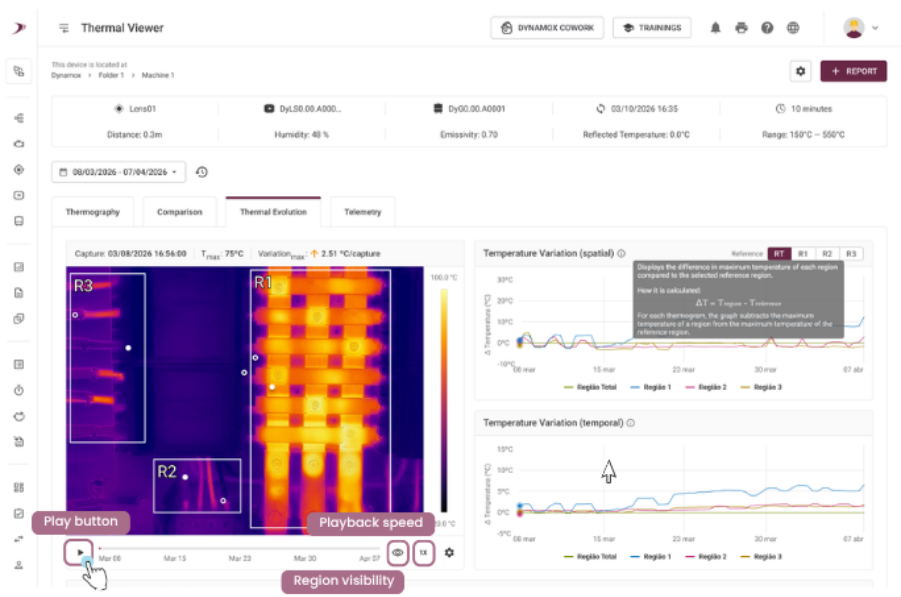
From now on, the Dynamox Lens Thermal Viewer generates a thermography report directly within the platform.

What changed? 

A new report generation button in the Thermal Viewer opens a modal where you can configure exactly what needs to be documented: 

  • Capture period 
  • Thermogram color palette 
  • Regions to include in the analysis 
  • Mode: thermogram, visible light image, or both  
  • Annotations and temperature scale: include or exclude 

Clicking Export automatically generates and downloads the formatted PDF. 

Plus: image downloads 

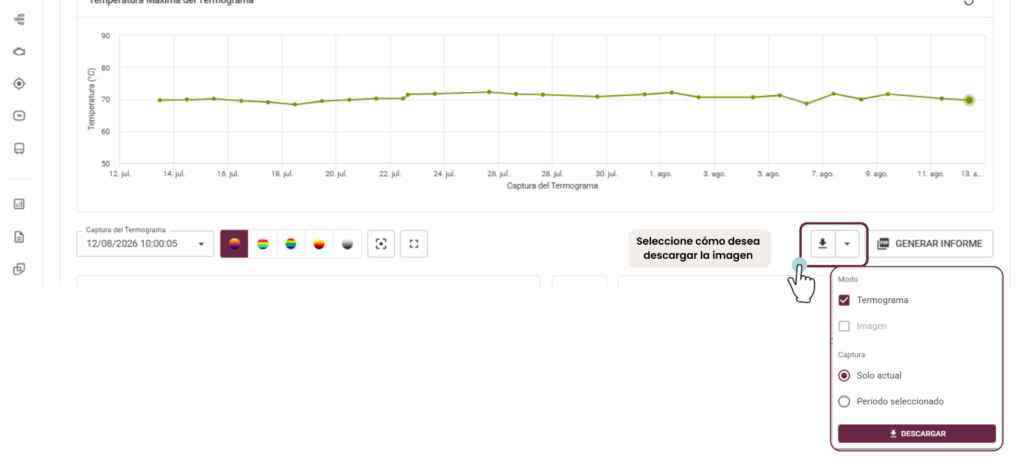
Beyond the report, you can now download individual thermographic images for presentations, comparisons, or your own report templates.

Selecting “Selected Period” generates a ZIP file with multiple images. Choosing “Thermogram + Image” downloads both images in the same file. 

What does this change in practice? 

Inspection evidence ready to attach to reports, with no layout revision needed 

Less operational time spent on internal reports 

Real monitoring traceability, featuring exportable documents with automatic asset and date identification 

This feature is already live and available in the web flow for any configured Dynamox Lens.


Audio Download in Spectral Viewer 

Download the vibration audio measured by the Spot and track equipment condition over time. 

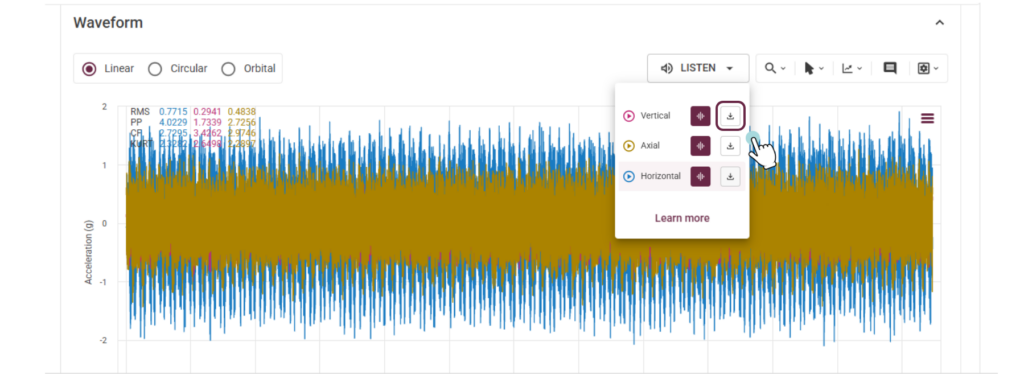
It is now possible to download the audio generated from the vibration measured by the Spot. This transforms what was once a transient on-screen sound into a permanent record, documenting exactly how the equipment behaved when an anomaly was identified. 

Audio is no longer just an impression; it becomes archivable, comparable, and transferable evidence across teams. 

What changes in practice? 

On-the-spot recording. Save the audio from the exact moment a deviation appeared, alongside the spectrum and waveform from that instance. 

Before and after interventions. Download the audio from the same point post-repair and compare. It provides a direct way to demonstrate maintenance results—whether to operations, leadership, or the execution team. 

Beyond the platform. Attach it to technical reports, leverage it in critical analysis meetings and presentations, or share it with another analyst for a second opinion. 

Details 

  • Downloads are generated as separate files for each axis. 
  • Exported in WAV format, compatible with standard media players and audio analysis software. 

This feature is already available in the Spectral Viewer. 


Asset Tree Redesign 

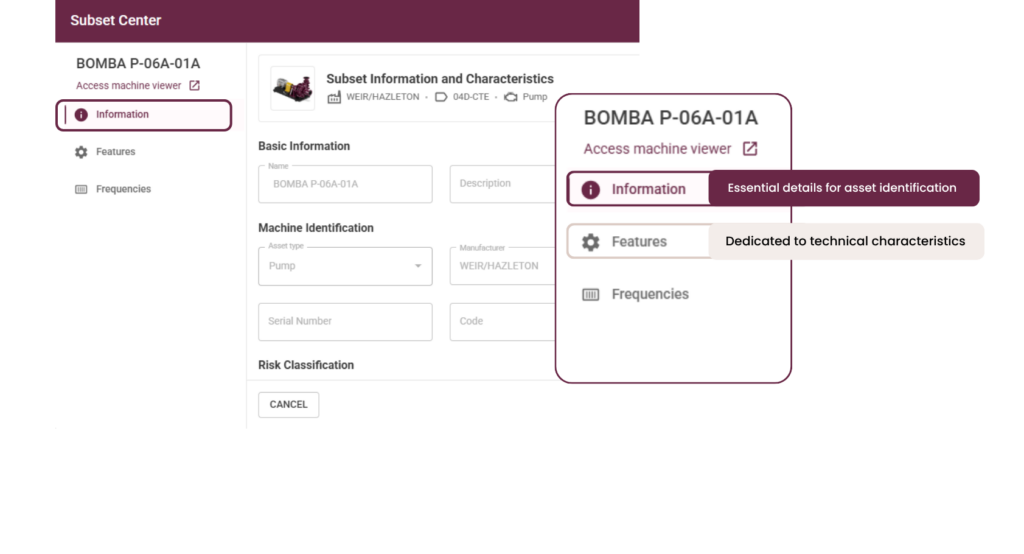
The Asset Tree has been redesigned to make asset registration and editing simpler and more intuitive.

Previously, general and technical information were combined in a single form, making data entry tedious. The process is now divided into two clear steps: 

  1. Information — asset type, risk class, business risk, and other data common to any asset. 
  1. Technical Characteristics — displayed only when the selected asset type has specific technical fields. 

This new structure streamlines the flow. First, you fill in what is common to all assets, then move on to the technical details. 

The result: faster, more consistent, and easier-to-review registrations. 

These improvements were designed to make your monitoring more intuitive and efficient, contributing to a more agile and clear operation in your daily routine. 
iOS version: August | 2026

The new Android update is now available!

Discover the latest features introduced in this version of the Dynamox app.


Spot sorting by collection date

The Dynamox app now enables users to view and sort spots by their last collection date. Simply toggling the “Spots Only” switch on the Machines screen switches from the tree view to the spot list, which is automatically sorted by those that have gone the longest without collection. 

The sorting icon (bottom right corner) allows reversing this order when necessary, and each spot displays the date and type of its last collection (telemetry or spectral). 

This empowers users to prioritize inspection routes and prevent sensors from being overlooked, especially in plants with a large number of monitoring points. 

These improvements were designed to make your monitoring more intuitive and efficient, contributing to a more agile and clear operation in your daily routine. 
Do you have any questions or want to know more details about any of these updates? 
Talk to our team

See you next time! 
Dynamox Team 

Android version: August | 2026

The new Android update is now available!

Discover the latest features introduced in this version of the Dynamox app.


Spot sorting by collection date

The Dynamox app now enables users to view and sort spots by their last collection date. Simply toggling the “Spots Only” switch on the Machines screen switches from the tree view to the spot list, which is automatically sorted by those that have gone the longest without collection. 

The sorting icon (bottom right corner) allows reversing this order when necessary, and each spot displays the date and type of its last collection (telemetry or spectral). 

This empowers users to prioritize inspection routes and prevent sensors from being overlooked, especially in plants with a large number of monitoring points. 

These improvements were designed to make your monitoring more intuitive and efficient, contributing to a more agile and clear operation in your daily routine. 
Do you have any questions or want to know more details about any of these updates? 
Talk to our team

See you next time! 
Dynamox Team 

Web: August | 2026

Hello,

Stay up to date with the latest features and enhancements we’ve just launched on the Dynamox Platform.

Check out what’s new and leverage these updates to their fullest!


Description and location in the Lens registry 

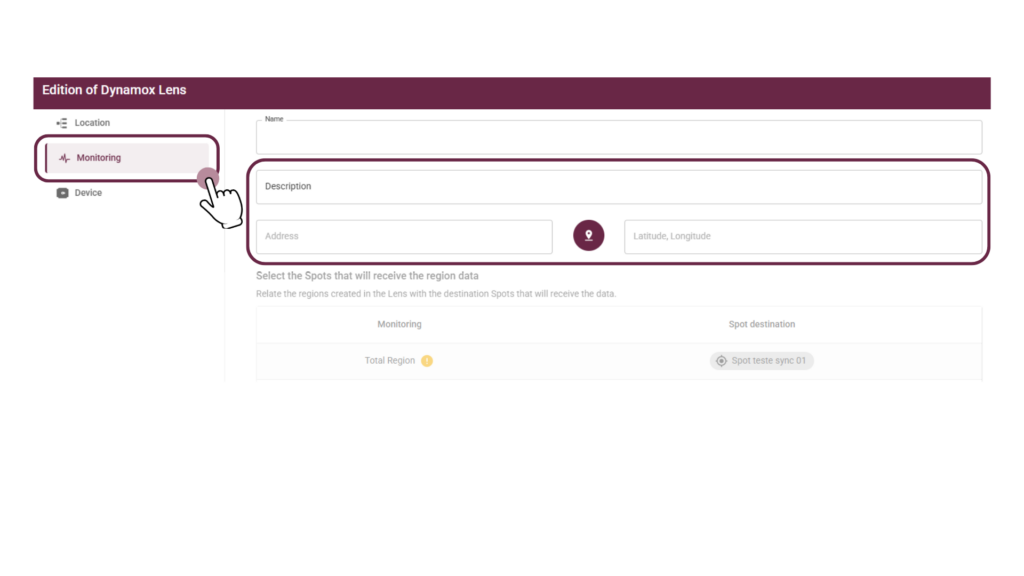
The Monitoring tab, under Lens Configuration, now features a free-text Description field and geographic location logging for the device. 

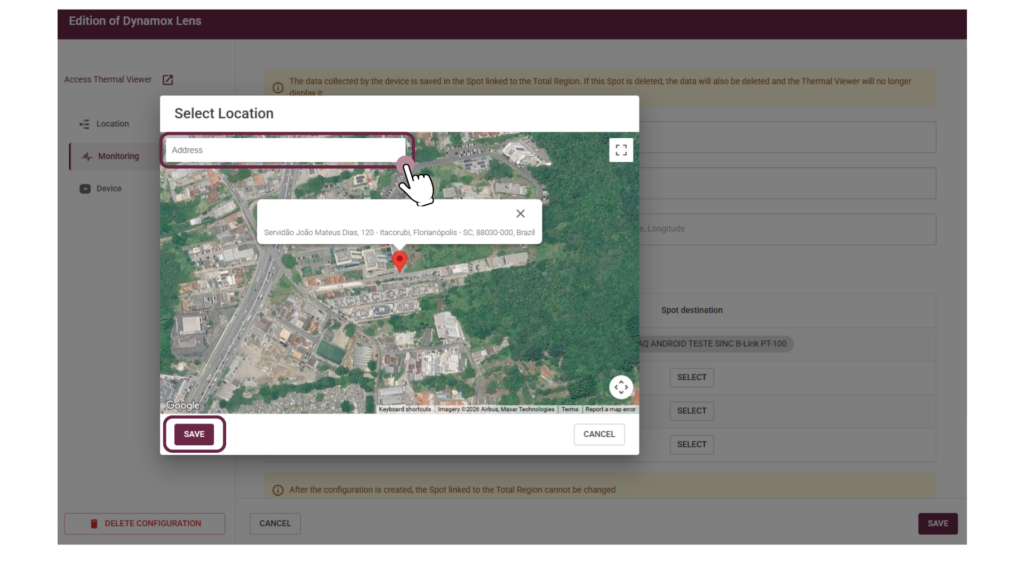
Just by clicking the pin button to open the map and select the point, the address and coordinates (latitude/longitude) are automatically populated.

This streamlines the identification of each Lens, enabling operators to precisely record the installation site and avoid ambiguity when multiple devices are located on the same plant.  

New “gatewayName” column in Monitoring Management CSVs

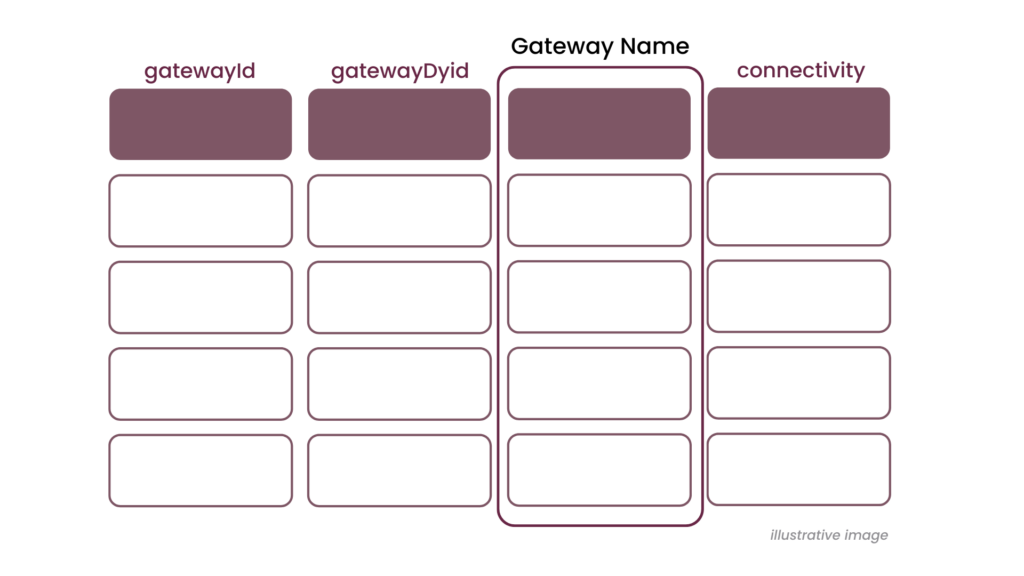
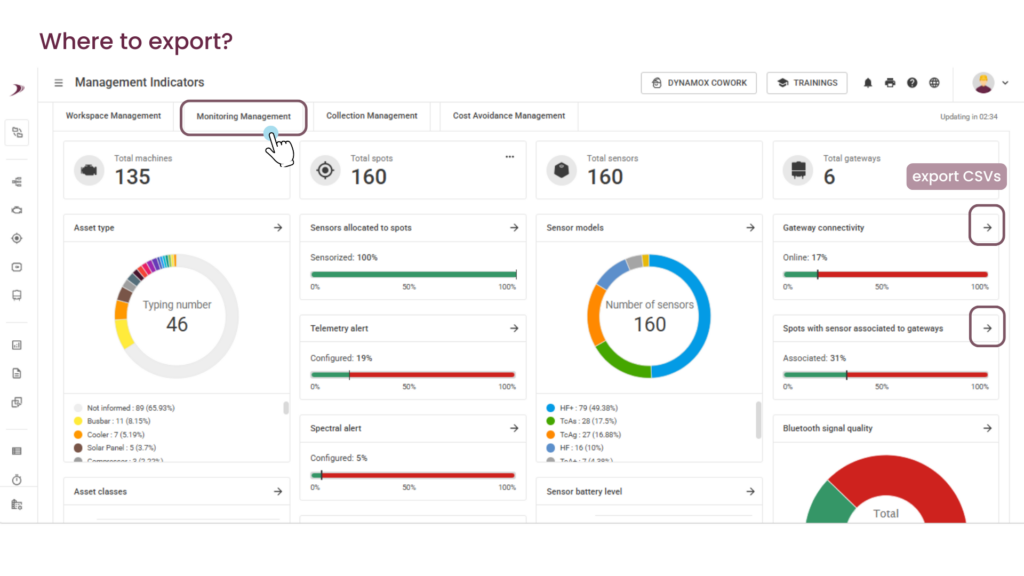
All Gateway CSVs now include the GatewayName column. Previously, the list only displayed ID and DyID; now, item identification is immediate.

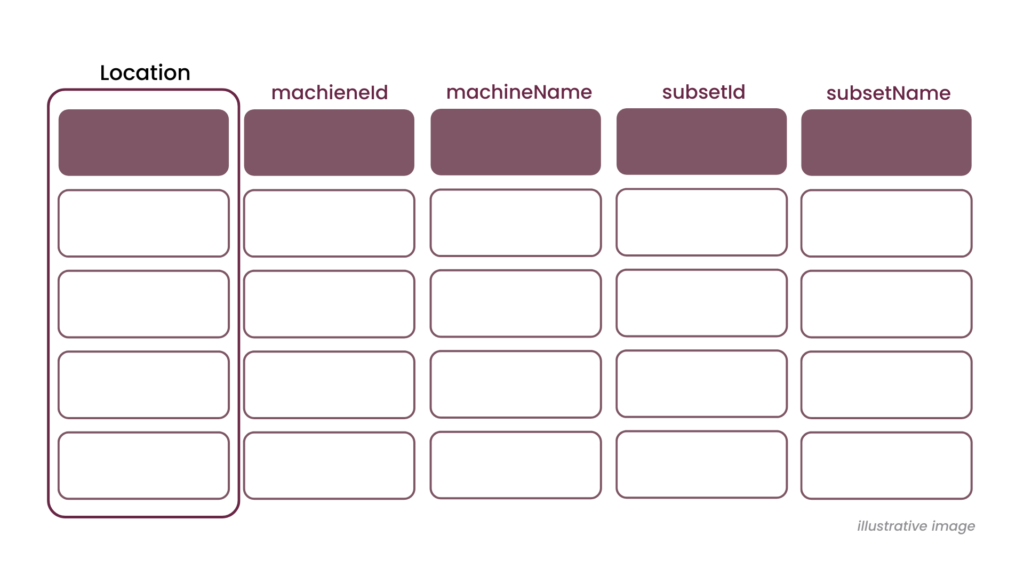
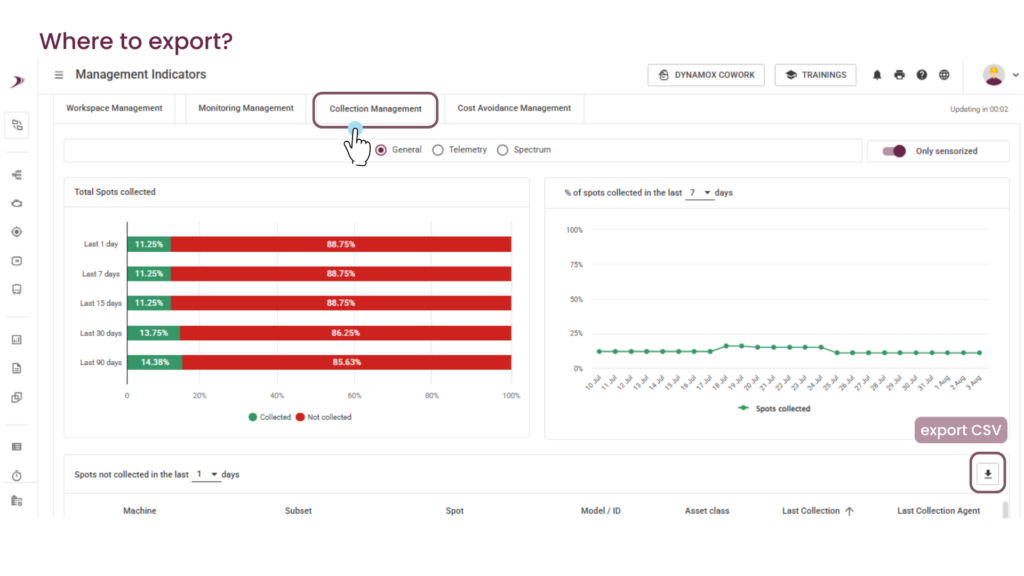
New “Location” and “gatewayName” columns in the Collection Management CSVs

The Uncollected Spots CSV has gained two new columns: a breadcrumb detailing the full path from the asset to the machine (areas and subareas), and the GatewayName column, populated when the last collection agent is a gateway. This provides clearer visibility into the Spot’s location and the agent responsible for its collection.

These improvements were designed to make your monitoring workflow more intuitive and efficient, contributing to a faster and clearer operation in your day-to-day activities.  

If you have questions or want more details about any of these updates, talk to our team!   

Until next time! 

Dynamox Team

Web: July | 2026

Hello,

Stay up to date with the latest features and enhancements we’ve just launched on the Dynamox Platform.

Check out what’s new and leverage these updates to their fullest! 
___________________________________

Conveyor Belts: End-to-End Monitoring 

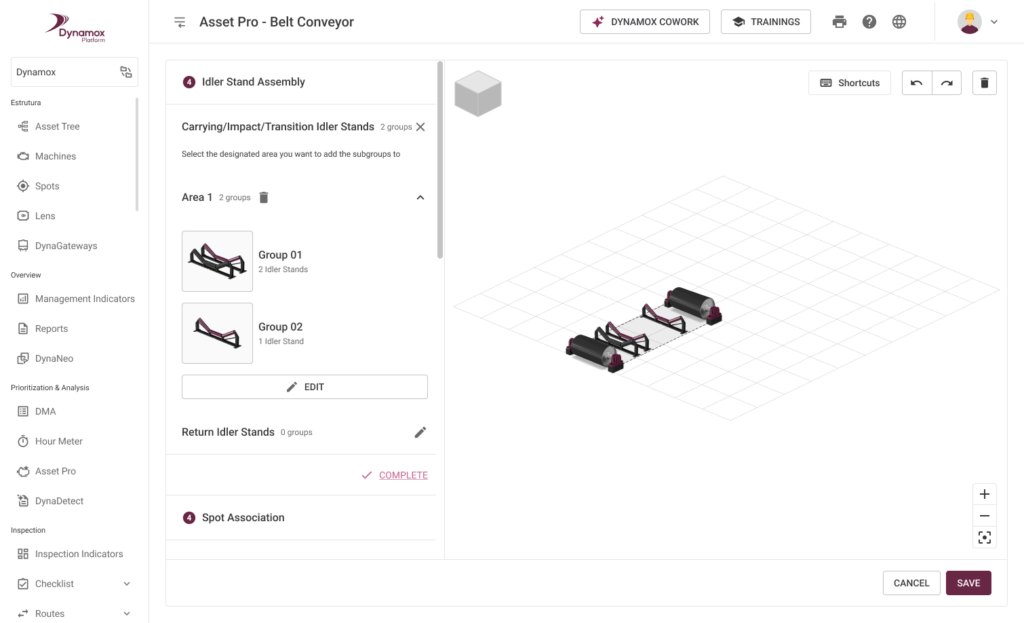
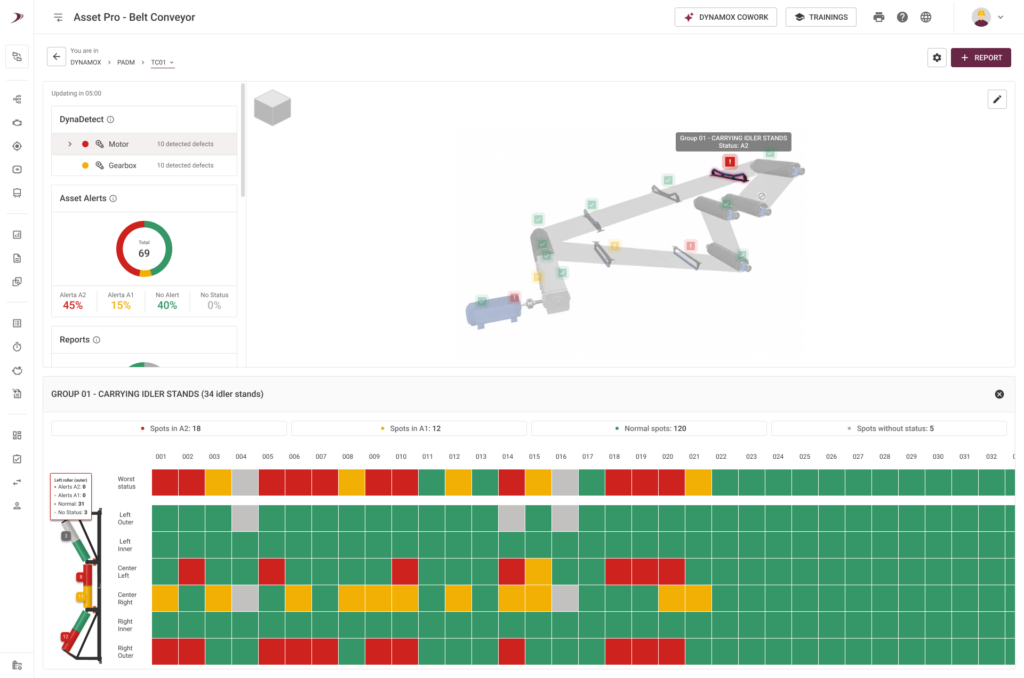
Asset Pro has taken a leap in Conveyor Belt monitoring. Now, beyond monitoring the drive and pulleys, it delivers total visibility over the conveyor structure: the Idler Frames and Rollers. 

  • Complete System Overview: Users can now configure loading, impact, and return idlers directly on the platform. This enables the actual belt structure to be represented within the system, ensuring management stays true to field reality. 

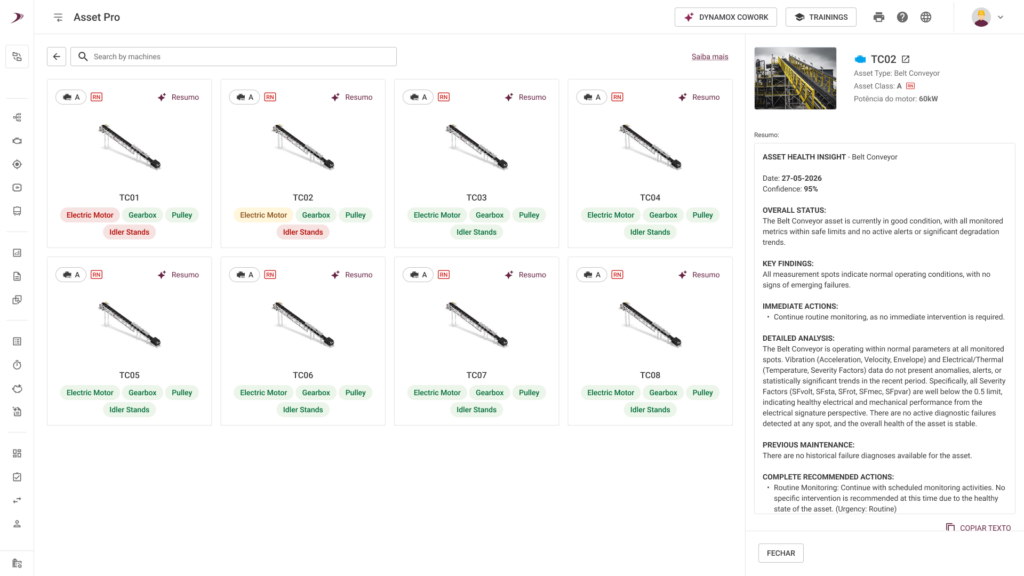
Roller Health in the Conveyor Belt list: A new status indicator for rollers automatically appears in the list whenever the conveyor belt has configured idlers. This streamlines the triage of multiple conveyors without the need to open each dashboard individually. 

  • Heat Map for Prioritization: No more spot-by-spot analysis. The new heat map empowers users to visually identify critical sections of the belt. Colors indicate alert severity along the entire extension, directing the maintenance team exactly to where action is needed. 
  • Intelligence with Dynamox Cowork: Dynamox Cowork can generate AI-curated insights, providing an automatic summary of the equipment’s status. 
  • 3D and Reports Integration: Idler frames are now part of the complete experience. They appear in the 3D model with status information and are integrated into the reporting workflow, ensuring full traceability of inspections across the entire conveyor. 

The real benefit: It empowers you to manage the conveyor as a complete system. The Heat Map drastically reduces triage time, transforming hundreds of sensors into strategic visual data that optimizes your maintenance efforts. 

Note: In this phase, idler and roller monitoring focuses on temperature and vibration telemetry, while automated fault detection (DynaDetect) remains available for Motors, Gearboxes, and Pulleys. 

_________________________________ 

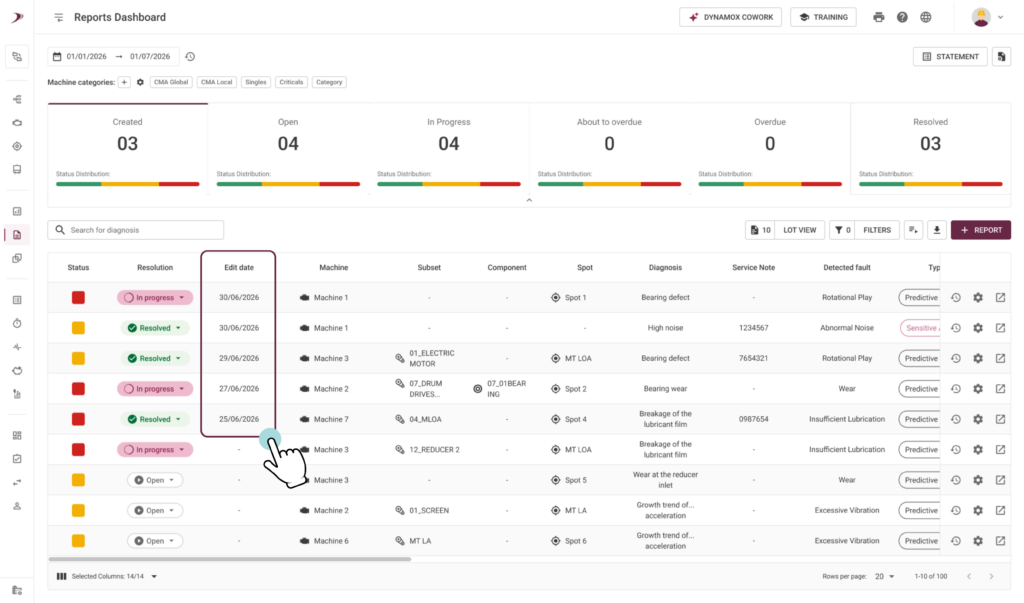
Total Traceability: Last Report Update Date on the Reports Dashboard 

To streamline the analysis workflow tracking and ensure the most recent data is always at hand, we have added the last report update date directly to the dashboard. 

  • Immediate Visibility: Now, the main screen of the Reports Dashboard features a dedicated column showing exactly when each report was last updated. This enables quick identification of which assets have recent analyses and which might need a new review. 
  • Streamlined Prioritization: This new visual information empowers operation and maintenance teams with the agility to prioritize checks and alignments, driving efforts to where the analysis is most critical or has been outdated for the longest time. 
  • Consistent Data: This information has also been included in the CSV export, ensuring the last analysis date follows the asset’s history even in external reports or BI tools. 

The real benefit: It delivers total control over the recency of your analyses. This transparency eliminates doubts about a diagnosis’s validity and accelerates decision-making, ensuring maintenance is consistently driven by updated and reliable data. 

These improvements were designed to make your monitoring workflow more intuitive and efficient, contributing to a faster and clearer operation in your day-to-day activities.  

If you have questions or want more details about any of these updates, talk to our team!   

Until next time! 

Dynamox Team

Web: July | 2026

Hello,

Stay up to date with the latest features and enhancements we’ve just launched on the Dynamox Platform.

Check out what’s new and leverage these updates to their fullest! 
___________________________________

1.Bulk Checklist Association 

Users can now associate multiple checklists with multiple assets at once, eliminating the need for item-by-item configuration. What once required a manual, time-consuming effort can now be accomplished in just a few steps, directly within the platform, streamlining operations without relying on support tools. 

Associate without breaking the flow: from the Manage Checklists screen, users select the desired checklists via checkboxes and trigger the bulk association right there—keeping the management workflow seamless. The action can also be initiated directly from the toast notification displayed after creating or editing a checklist. 

Guided workflow: The association panel drives the user through three clear stages: Select (choosing assets, leveraging filters and search), Review (making adjustments before confirmation), and Summary (a consolidated view of assets, checklists, and locations). This delivers complete visibility over the entire process. 

Flexible asset selection: in the selection stage, users view columns such as Asset, Type, Class, and Description, empowering them to filter or search to pinpoint the exact machines required. 

Final validation: before finalizing, users can review and modify the established associations, proactively reducing setup errors.

The real benefit: Configuring the Asset Tree becomes a centralized and agile process. It empowers users with unparalleled autonomy and control over how they organize their checklists. 

These improvements were designed to make your monitoring workflow more intuitive and efficient, contributing to a faster and clearer operation in your day-to-day activities.  

If you have questions or want more details about any of these updates, talk to our team!   

Until next time! 

Dynamox Team

Web: June/2 | 2026

Hello,

Stay up to date with the latest features and enhancements we’ve just launched on the Dynamox Platform.

Check out what’s new and leverage these updates to their fullest! 

__________________________________________

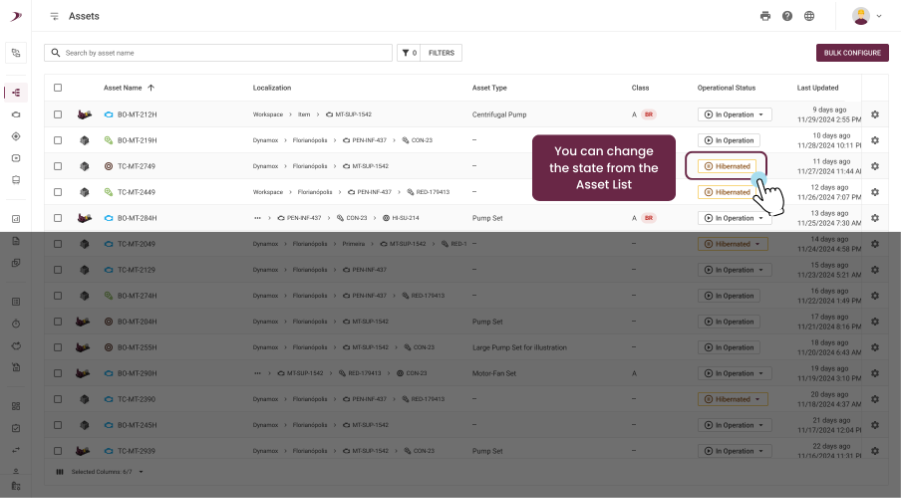
1. New Asset list: Everything in a single view 

Less time searching, more time analyzing. We transformed the old Machines screen into the new Asset List, designed to offer maximum visibility and speed when searching for information. 

Unified View: Now, Machines, Subsets, and Components appear in a single list, eliminating the need to navigate deep into the tree to find what you need. 

Visual Context: We added 3D models representing the type of each asset and new columns such as “Location” and “Configured at”. 

Advanced Filters and Infinite Table: Find assets instantly with new filters and fluid navigation, without switching pages. 

The real benefit: Gain operational speed and total control over your asset park, in addition to quickly identifying configuration gaps. 

___________________________ 

2. Analysis Plans: More visibility and realistic deadlines 

We improved the experience for those who execute and manage analysis plans, combining quick visual information with time management that respects your planning. 

Evolution of the Report Indicator: The status icon in the execution tree is now smarter. Instead of showing just the current cycle, it reflects the condition of the last report performed on the spot (within a 90-day window). If the report is older, the icon remains empty, but simply hovering the mouse will show how many days ago the last analysis was registered. 

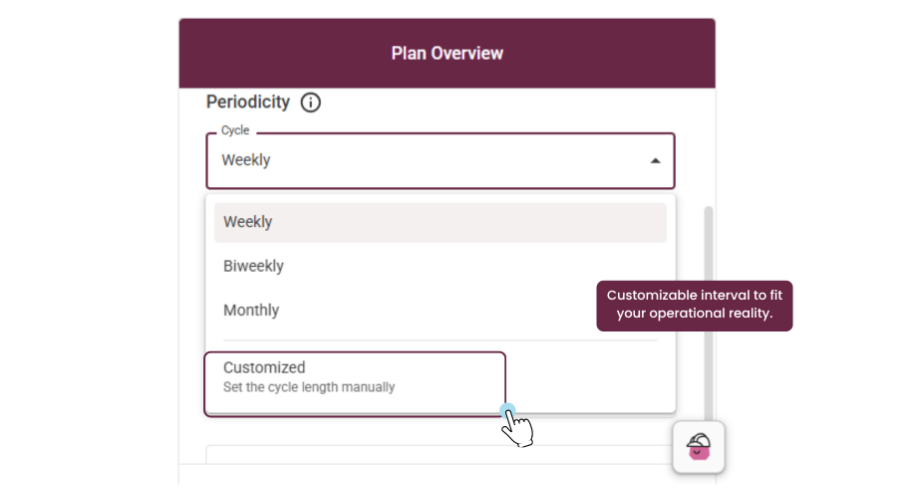
Deadlines that match your pace: The time to complete the analyses is now exactly equal to the plan’s periodicity. If the plan is biweekly, you have 14 days; if it’s monthly, you have the entire month. This ensures that the adherence rate is calculated in a much fairer and more realistic way. 

Smart Status and Transition: With this change, plans that previously appeared as “Coming soon” may now appear as “Open” or “In progress” right at the beginning of the cycle, since the execution period now covers the entire interval. 

Direct Shortcut: See a point of attention (yellow or red icon)? Click directly on the icon to open the report and understand what is happening, without having to navigate through other menus. 

The real benefit: You gain a fluid workflow, where you can visually identify priorities and have deadlines consistent with the reality of your operation. 

Remember: closing the cycle remains manual after reaching 100% of the analyses, ensuring you have the final control over the closure. 

______________________________

These enhancements are designed to make your monitoring more intuitive and efficient, driving a more agile and streamlined daily operation.

Have questions or want to learn more about these updates?
Reach out to our team!

Until next time!
The Dynamox Team

DynaSummit 2026 | New DMA

Hello,

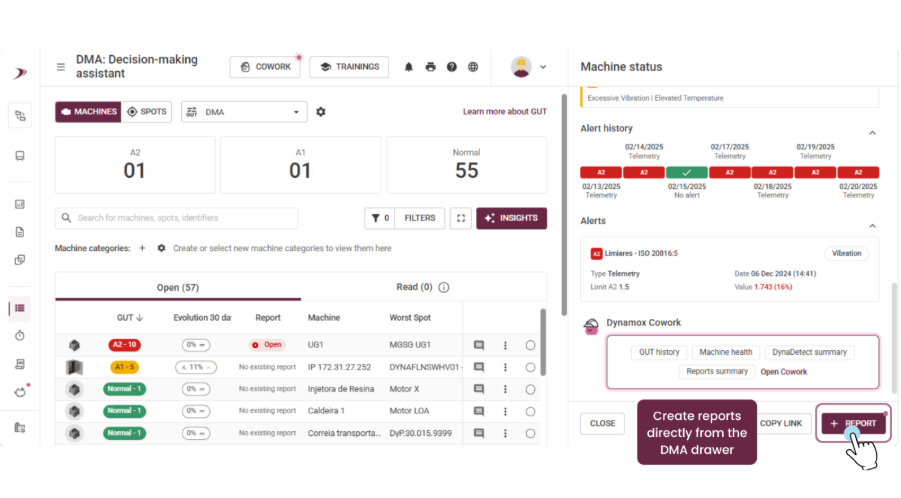
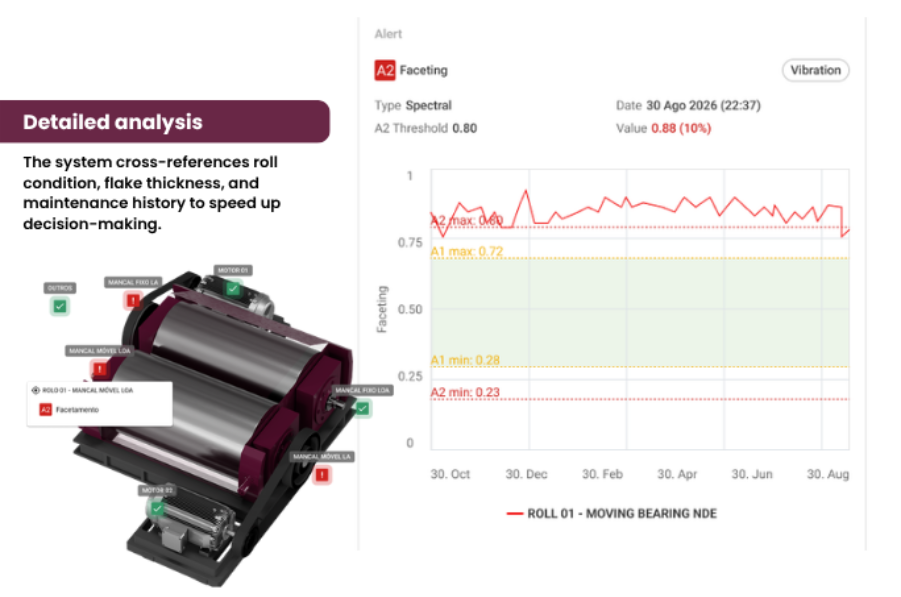
Managing hundreds of assets and simultaneous alerts demands more than experience, it requires clear, consistent prioritization aligned with real business risk.  Introducing the new Dynamox DMA (Decision-Making Assistant), a breakthrough that transforms how maintenance teams analyze, prioritize, and act on their critical assets. 

IMAGEM-01-EN

With the new DMA, your team can now:  Intelligent Asset Prioritization. Leverage the GUT methodology to move beyond simple alert sorting and focus on what truly matters. 1-to-1,000 Prioritization Score. Instantly pinpoint which assets pose the greatest operational risk.   

Unified Command Center. Access all critical analytics on a single, streamlined dashboard for rapid insights. Customizable Rule Engine. Configure the GUT matrix with multiple variables to match the reality of your operation. Efficient Analysis Workflow. Use Open and Read tabs to ensure no critical asset is ever overlooked. Context-Driven Collaboration. Link comments directly to each machine or spot, streamlining communication across shifts and teams.

IMAGEM-02-EN

Ready to transform your maintenance strategy?

Explore the DMA revolution.Contact our team!   

See you next time!  
Dynamox Team 

Web: June | 2026

Hello,

Stay up to date with the latest features and enhancements we’ve just launched on the Dynamox Platform.

Explore what’s new and leverage these updates to their fullest!
_________________________________________

1. Security First: Configure MFA for your Dynamox Web and Mobile Platform Access. Empowering data protection, the Dynamox Platform now features Multi Factor Authentication (MFA). 


How it works: Upon entering your credentials on the login screen, a 6 digit code will be sent to your email to verify your identity. 


Seamless access: The system authorizes your device for 180 days, streamlining your workflow before requiring a new validation. 


Important: The code remains valid for 60 seconds. If it expires, simply request a resend.

This extra protection layer is mandatory for non-SSO users, guaranteeing your asset data remains continuously secure. 

This extra protection layer is mandatory for non SSO users, guaranteeing your asset data remains continuously secure. 
_______________________________________

2.StreamlinedIntegrations: Dynamox API Connector 

Connecting Dynamox data to BI tools (PowerBI), corporate dashboards, or industrial systems is now more seamless and stable with the new Dynamox API Connector. 

Static Keys: API keys are now linked directly to an application, providing a longer usage period compared to the previous one-hour dynamic tokens. This eliminates the need for token refresh routines during API usage. 

Full Autonomy: Administrators can seamlessly create, manage, and revoke keys directly within the platorm, setting expiration dates of up to one year. 

Advanced Security: The key is displayed only once upon creation. For security purposes, it cannot be viewed again, ensuring only the integration owner has access. 

User-Friendly: A straightforward authentication header replaces the complex hourly expiring token logic, ensuring compatibility with virtually any market software. 

How to start: Access the Administration > Connectors menu, locate the Dynamox API card, and request your connection. 

Ensure continuous integrations and uninterrupted dashboards, transforming raw data into strategic decisions with full autonomy and security.
________________________________________

3. RealContext:Visible Light Image in Dynamox Lens 

Thermal analysis now leverages visual support from the real scene. The new Visible Light Image feature delivers total clarity regarding which component is being monitored in Dynamox Lens. 

Slider Overlay: Toggle between the thermogram and the actual asset photo using an opacity control, streamlining the exact identification of hotspots. 

Heat Highlight: Enable the highlight mode to make cold areas transparent, revealing the real image only where the temperature exceeds the defined threshold. 

Comparative Analysis: Leverage linking tools to compare different captures or modes (image vs. thermogram) side-by-side with precise alignment. 

Eliminate diagnostic uncertainties and accelerate report generation, ensuring interventions target the exact location of the detected issue.
_______________________________________

4. Hour Meter Management: Everything in One Place 

The hour meter management workflow is now optimized, making the maintenance planner’s daily routine significantly more agile and intuitive. 

Total Centralization: Create, edit, configure hour meters, and reset hours directly on the module page, eliminating the need to navigate across different platform screens. 

Smart Configuration: The system now provides an automatic suggestion for the operating level. It analyzes the asset’s vibration history and calculates the ideal value to identify when the machine is running or idle. 

Streamlined Management: Side drawers enable quick adjustments to base spots and metrics, empowering users to maintain focus on analyzing asset availability. 

Minimize manual configuration time and drive highly accurate utilization data for your preventive maintenance plan. 

__________________________________________________
5. Dynamox Cowork via App 
Seamlessly access and interact with Dynamox Cowork directly through the Dynamox App.

DynaSummit 2026 | Dynamox Cowork

DynaSummit attendees witnessed a milestone in Dynamox’s history. We didn’t just launch a new feature; we introduced the predictive sector’s first multi-agent AI: Dynamox Cowork. 

Today’s industrial challenge isn’t a lack of data; it’s the manpower and time required to turn that data into accurate decisions. Dynamox Cowork was built to solve this, acting as your new Coworker. 

What is Dynamox Cowork? 

Available within the Dynamox platform, Cowork goes beyond simple chatbots. It delivers an ecosystem of Digital Coworkers—specialized AI agents across various maintenance domains designed to work alongside your team. Instead of replacing your analysts, they empower their technical excellence. 

How it transforms your operations: 

Execution over consultation: your new Coworkers draft reports, analyze complex charts, and cross-reference historical data in seconds. 

Technical Consistency: over 15 digital specialists ensure every diagnosis meets the highest quality standards, scaling seamlessly regardless of alert volumes. 

Collaborative Intelligence: continuous team interaction refines the system, turning vibration data into targeted actions that prevent unplanned downtime. 

Purpose-Driven Innovation 

At Dynamox, we don’t build AI for the sake of AI. We engineer technology to protect the assets that drive your industry. Cowork materializes this vision: a Peer-to-Peer (specialist to specialist) tool focused on real productivity. 

The future of maintenance is no longer about analyzing isolated charts; it is about orchestrating an advanced digital workforce. 

Ready to evolve? 
If you have any questions on how to integrate Coworkers into your workflow, Get in touch with our team

Best regards, Dynamox Team