Stay up to date with the latest features and enhancements we’ve just launched on the Dynamox Platform.
Check out what’s new and leverage these updates to their fullest! ___________________________________
1.Bulk Checklist Association
Users can now associate multiple checklists with multiple assets at once, eliminating the need for item-by-item configuration. What once required a manual, time-consuming effort can now be accomplished in just a few steps, directly within the platform, streamlining operations without relying on support tools.
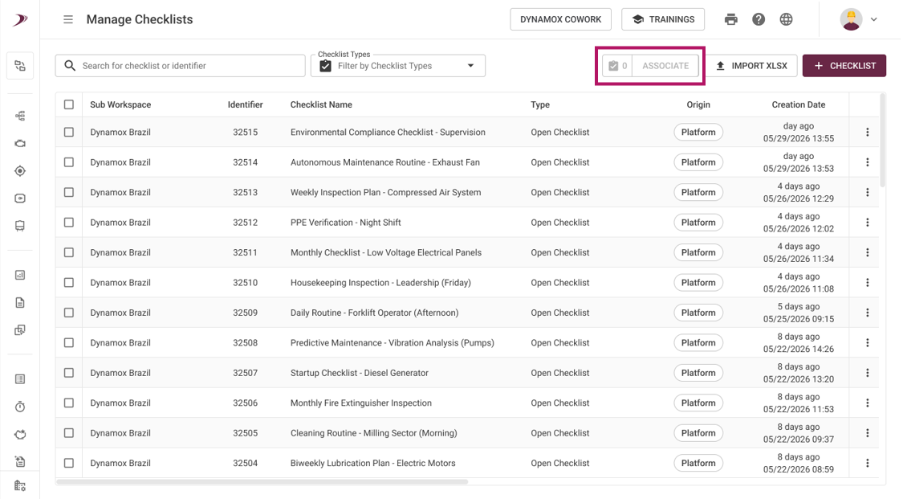
Associate without breaking the flow: from the Manage Checklists screen, users select the desired checklists via checkboxes and trigger the bulk association right there—keeping the management workflow seamless. The action can also be initiated directly from the toast notification displayed after creating or editing a checklist.
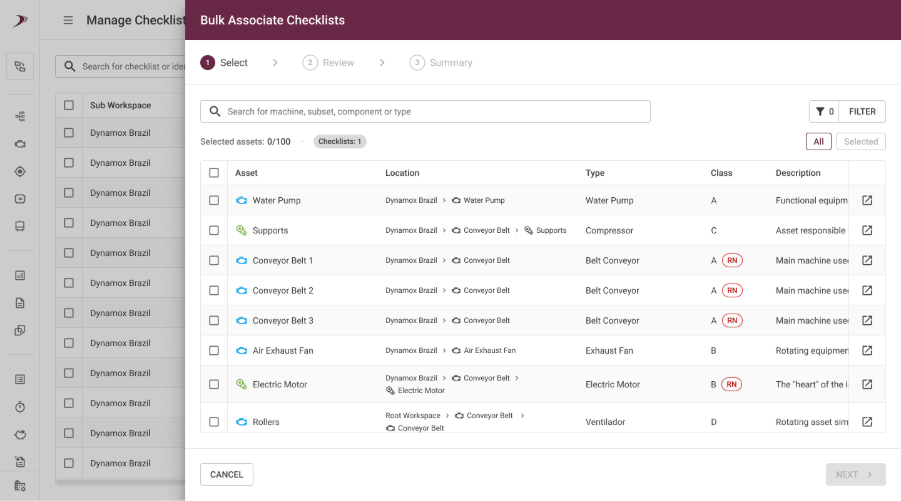
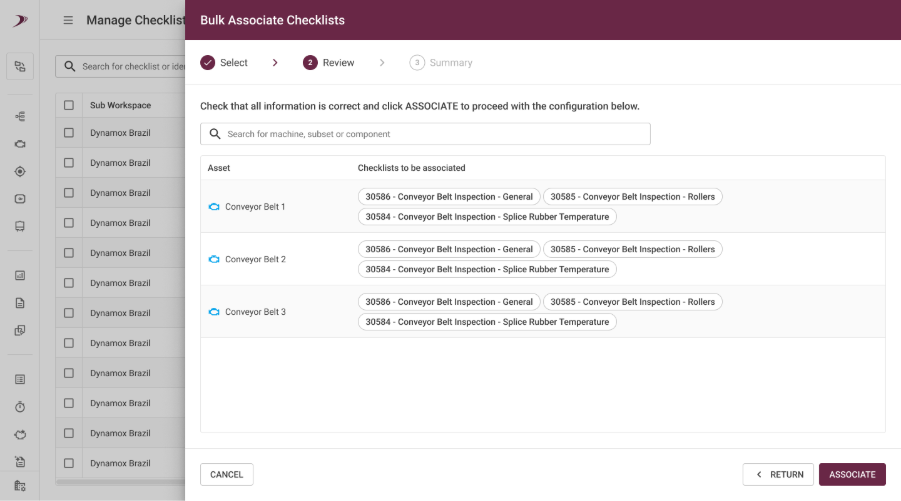
Guided workflow: The association panel drives the user through three clear stages: Select (choosing assets, leveraging filters and search), Review (making adjustments before confirmation), and Summary (a consolidated view of assets, checklists, and locations). This delivers complete visibility over the entire process.
Flexible asset selection: in the selection stage, users view columns such as Asset, Type, Class, and Description, empowering them to filter or search to pinpoint the exact machines required.
Final validation: before finalizing, users can review and modify the established associations, proactively reducing setup errors.
The real benefit: Configuring the Asset Tree becomes a centralized and agile process. It empowers users with unparalleled autonomy and control over how they organize their checklists.
These improvements were designed to make your monitoring workflow more intuitive and efficient, contributing to a faster and clearer operation in your day-to-day activities.
If you have questions or want more details about any of these updates,talk to our team!
Stay up to date with the latest features and enhancements we’ve just launched on the Dynamox Platform.
Check out what’s new and leverage these updates to their fullest!
__________________________________________
1. New Asset list: Everything in a single view
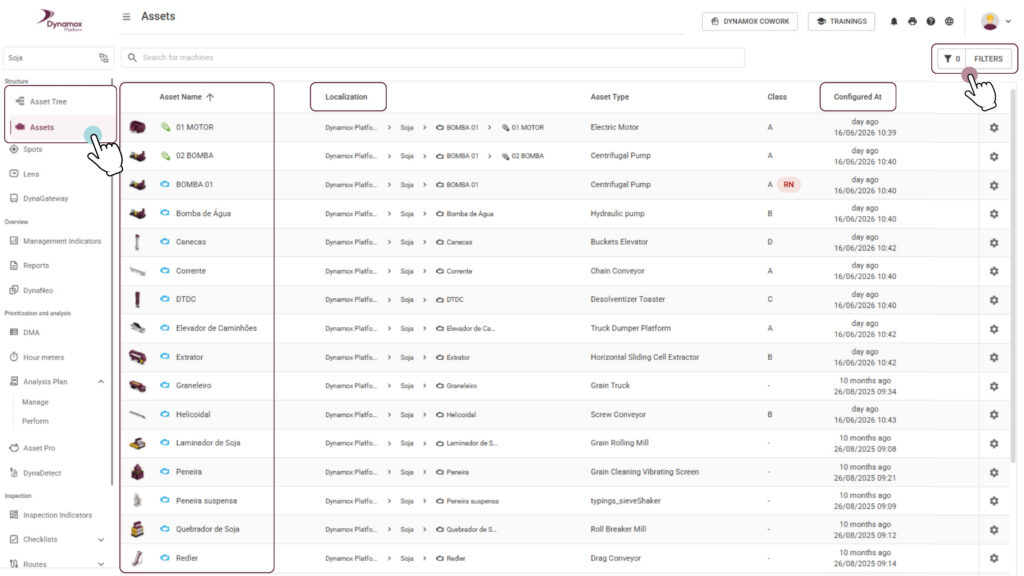
Less time searching, more time analyzing. We transformed the old Machines screen into the new Asset List, designed to offer maximum visibility and speed when searching for information.
Unified View: Now, Machines, Subsets, and Components appear in a single list, eliminating the need to navigate deep into the tree to find what you need.
Visual Context: We added 3D models representing the type of each asset and new columns such as “Location” and “Configured at”.
Advanced Filters and Infinite Table: Find assets instantly with new filters and fluid navigation, without switching pages.
The real benefit: Gain operational speed and total control over your asset park, in addition to quickly identifying configuration gaps.
___________________________
2. Analysis Plans: More visibility and realistic deadlines
We improved the experience for those who execute and manage analysis plans, combining quick visual information with time management that respects your planning.
Evolution of the Report Indicator: The status icon in the execution tree is now smarter. Instead of showing just the current cycle, it reflects the condition of the last report performed on the spot (within a 90-day window). If the report is older, the icon remains empty, but simply hovering the mouse will show how many days ago the last analysis was registered.
Deadlines that match your pace: The time to complete the analyses is now exactly equal to the plan’s periodicity. If the plan is biweekly, you have 14 days; if it’s monthly, you have the entire month. This ensures that the adherence rate is calculated in a much fairer and more realistic way.
Smart Status and Transition: With this change, plans that previously appeared as “Coming soon” may now appear as “Open” or “In progress” right at the beginning of the cycle, since the execution period now covers the entire interval.
Direct Shortcut: See a point of attention (yellow or red icon)? Click directly on the icon to open the report and understand what is happening, without having to navigate through other menus.
The real benefit: You gain a fluid workflow, where you can visually identify priorities and have deadlines consistent with the reality of your operation.
Remember: closing the cycle remains manual after reaching 100% of the analyses, ensuring you have the final control over the closure.
______________________________
These enhancements are designed to make your monitoring more intuitive and efficient, driving a more agile and streamlined daily operation.
Managing hundreds of assets and simultaneous alerts demands more than experience, it requires clear, consistent prioritization aligned with real business risk. Introducing the new Dynamox DMA (Decision-Making Assistant), a breakthrough that transforms how maintenance teams analyze, prioritize, and act on their critical assets.
With the new DMA, your team can now: Intelligent Asset Prioritization. Leverage the GUT methodology to move beyond simple alert sorting and focus on what truly matters. 1-to-1,000 Prioritization Score. Instantly pinpoint which assets pose the greatest operational risk.
Unified Command Center. Access all critical analytics on a single, streamlined dashboard for rapid insights. Customizable Rule Engine. Configure the GUT matrix with multiple variables to match the reality of your operation. Efficient Analysis Workflow. Use Open and Read tabs to ensure no critical asset is ever overlooked. Context-Driven Collaboration. Link comments directly to each machine or spot, streamlining communication across shifts and teams.
Stay up to date with the latest features and enhancements we’ve just launched on the Dynamox Platform.
Explore what’s new and leverage these updates to their fullest! _________________________________________
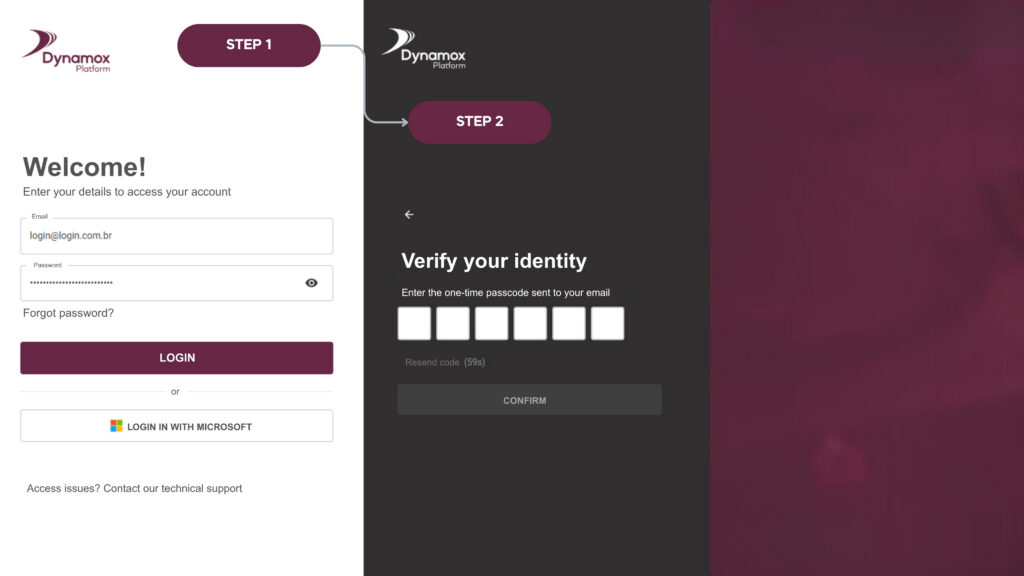
1. Security First: Configure MFA for your Dynamox Web and Mobile Platform Access. Empowering data protection, the Dynamox Platform now features Multi Factor Authentication (MFA).
How it works: Upon entering your credentials on the login screen, a 6 digit code will be sent to your email to verify your identity.
Seamless access: The system authorizes your device for 180 days, streamlining your workflow before requiring a new validation.
Important: The code remains valid for 60 seconds. If it expires, simply request a resend.
This extra protection layer is mandatory for non-SSO users, guaranteeing your asset data remains continuously secure.
This extra protection layer is mandatory for non SSO users, guaranteeing your asset data remains continuously secure. _______________________________________
2.StreamlinedIntegrations: Dynamox API Connector
Connecting Dynamox data to BI tools (PowerBI), corporate dashboards, or industrial systems is now more seamless and stable with the new Dynamox API Connector.
Static Keys: API keys are now linked directly to an application, providing a longer usage period compared to the previous one-hour dynamic tokens. This eliminates the need for token refresh routines during API usage.
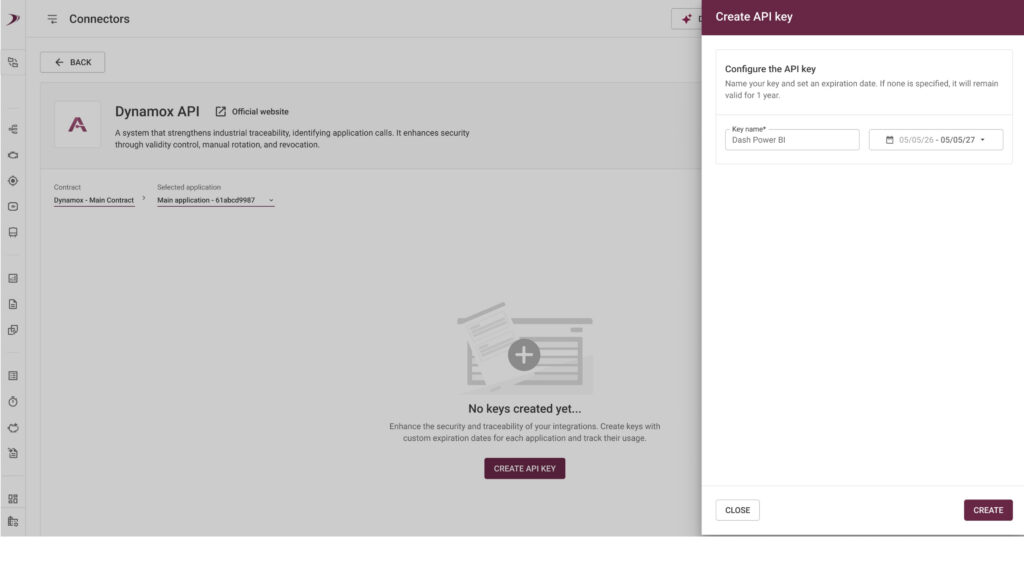
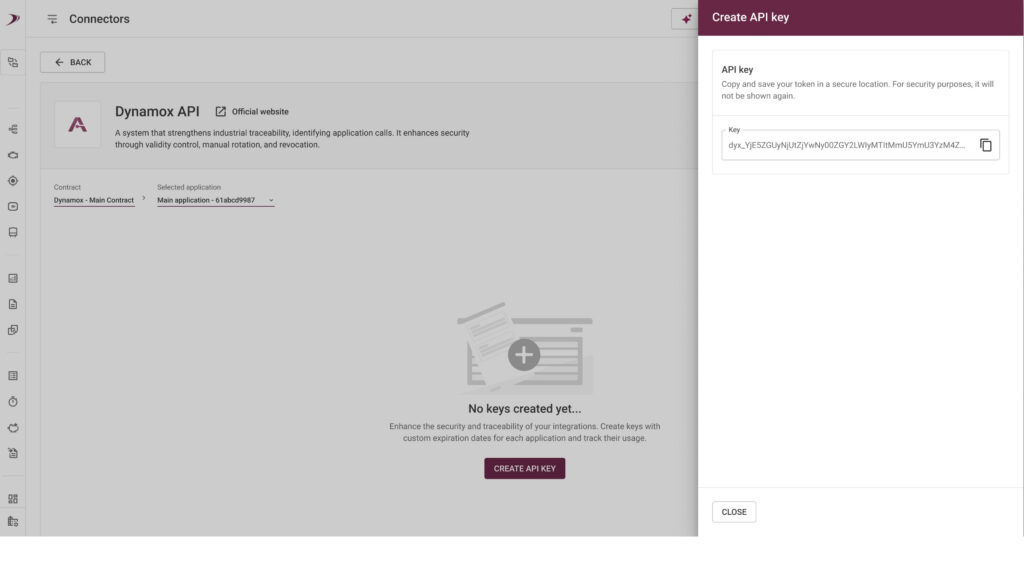
Full Autonomy: Administrators can seamlessly create, manage, and revoke keys directly within the platorm, setting expiration dates of up to one year.
Advanced Security: The key is displayed only once upon creation. For security purposes, it cannot be viewed again, ensuring only the integration owner has access.
User-Friendly: A straightforward authentication header replaces the complex hourly expiring token logic, ensuring compatibility with virtually any market software.
How to start: Access the Administration > Connectors menu, locate the Dynamox API card, and request your connection.
Ensure continuous integrations and uninterrupted dashboards, transforming raw data into strategic decisions with full autonomy and security. ________________________________________
3. RealContext:Visible Light Image in Dynamox Lens
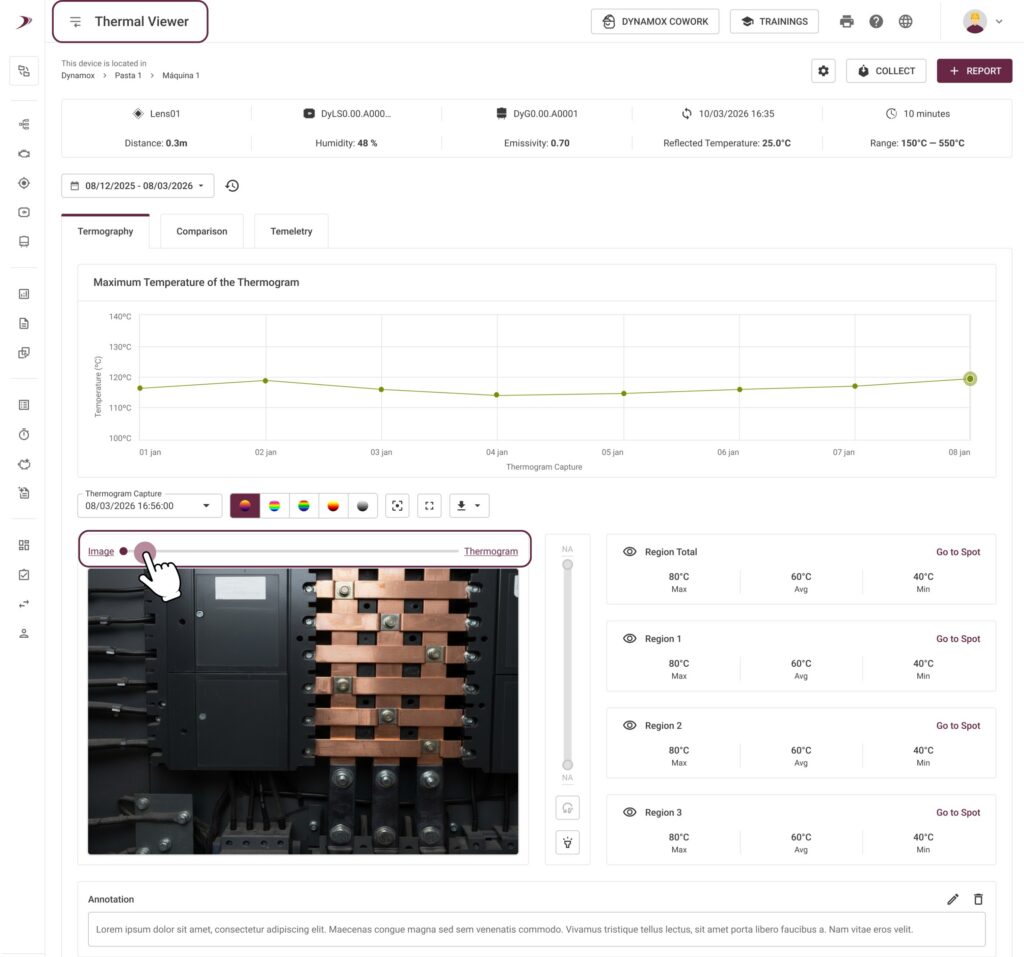
Thermal analysis now leverages visual support from the real scene. The new Visible Light Image feature delivers total clarity regarding which component is being monitored in Dynamox Lens.
Slider Overlay: Toggle between the thermogram and the actual asset photo using an opacity control, streamlining the exact identification of hotspots.
Heat Highlight: Enable the highlight mode to make cold areas transparent, revealing the real image only where the temperature exceeds the defined threshold.
Comparative Analysis: Leverage linking tools to compare different captures or modes (image vs. thermogram) side-by-side with precise alignment.
Eliminate diagnostic uncertainties and accelerate report generation, ensuring interventions target the exact location of the detected issue. _______________________________________
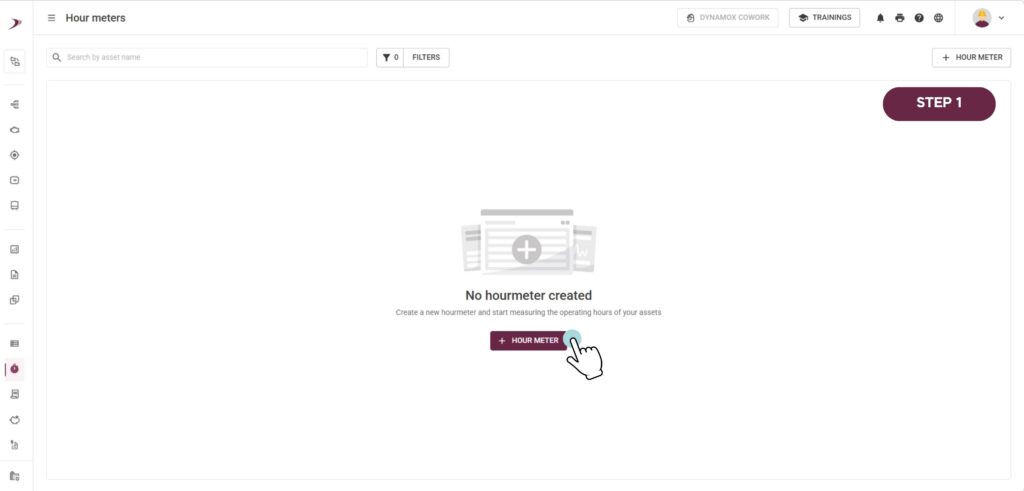
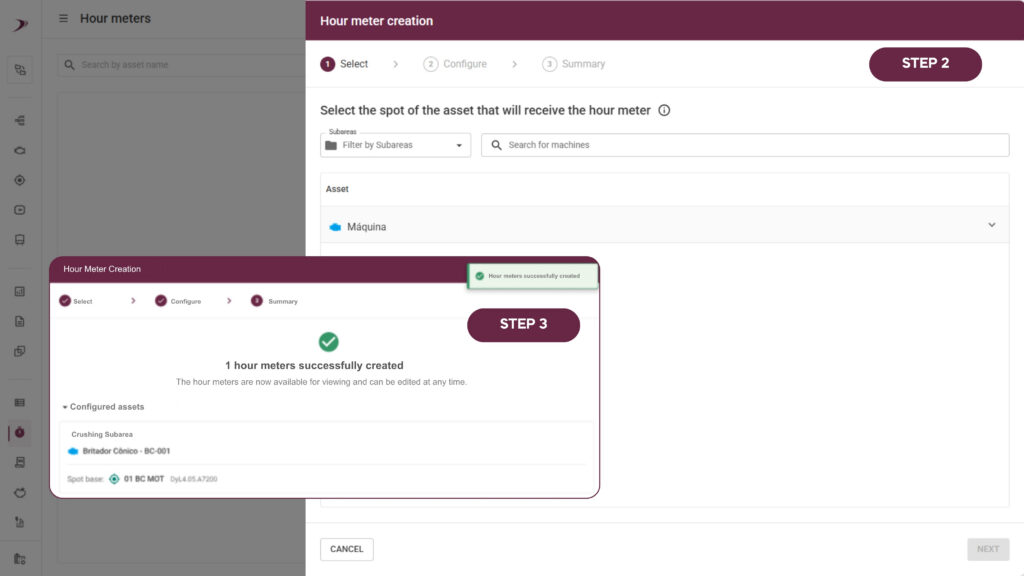
4. Hour Meter Management: Everything in One Place
The hour meter management workflow is now optimized, making the maintenance planner’s daily routine significantly more agile and intuitive.
Total Centralization: Create, edit, configure hour meters, and reset hours directly on the module page, eliminating the need to navigate across different platform screens.
Smart Configuration: The system now provides an automatic suggestion for the operating level. It analyzes the asset’s vibration history and calculates the ideal value to identify when the machine is running or idle.
Streamlined Management: Side drawers enable quick adjustments to base spots and metrics, empowering users to maintain focus on analyzing asset availability.
Minimize manual configuration time and drive highly accurate utilization data for your preventive maintenance plan.
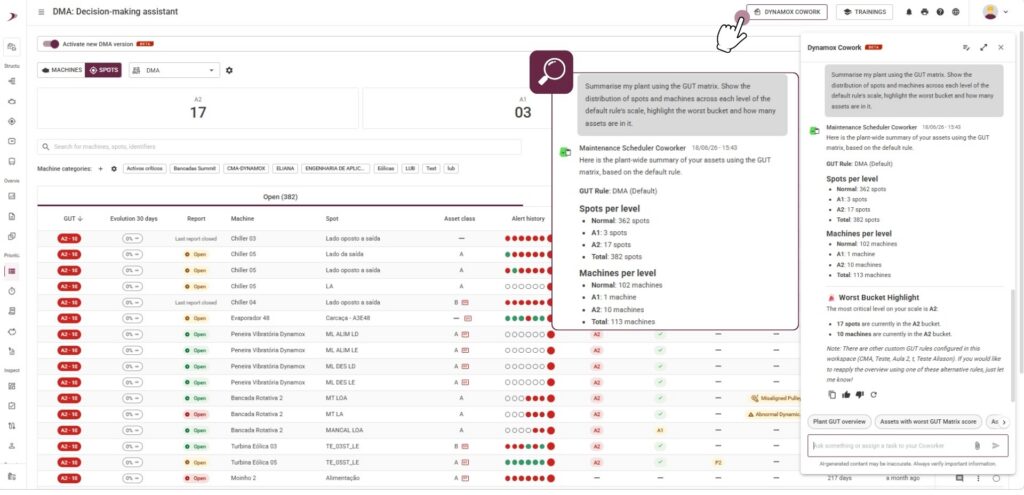
__________________________________________________ 5. Dynamox Cowork via App Seamlessly access and interact with Dynamox Cowork directly through the Dynamox App.
DynaSummit attendees witnessed a milestone in Dynamox’s history. We didn’t just launch a new feature; we introduced the predictive sector’s first multi-agent AI: Dynamox Cowork.
Today’s industrial challenge isn’t a lack of data; it’s the manpower and time required to turn that data into accurate decisions. Dynamox Cowork was built to solve this, acting as your new Coworker.
What is Dynamox Cowork?
Available within the Dynamox platform, Cowork goes beyond simple chatbots. It delivers an ecosystem of Digital Coworkers—specialized AI agents across various maintenance domains designed to work alongside your team. Instead of replacing your analysts, they empower their technical excellence.
How it transforms your operations:
Execution over consultation: your new Coworkers draft reports, analyze complex charts, and cross-reference historical data in seconds.
Technical Consistency: over 15 digital specialists ensure every diagnosis meets the highest quality standards, scaling seamlessly regardless of alert volumes.
Collaborative Intelligence: continuous team interaction refines the system, turning vibration data into targeted actions that prevent unplanned downtime.
Purpose-Driven Innovation
At Dynamox, we don’t build AI for the sake of AI. We engineer technology to protect the assets that drive your industry. Cowork materializes this vision: a Peer-to-Peer (specialist to specialist) tool focused on real productivity.
The future of maintenance is no longer about analyzing isolated charts; it is about orchestrating an advanced digital workforce.
Ready to evolve? If you have any questions on how to integrate Coworkers into your workflow, Get in touch with our team!
Stay up to date with the latest features and enhancements we’ve just launched on the Dynamox Platform.
Check out what’s new and leverage these updates to their fullest! ___________________________________
1. Asset Pro: New Ball Mill Asset
The Asset Pro module now delivers full support for Ball Mill monitoring. We designed this solution to transform critical asset management, providing expert assistance that streamlines technical analysis and drives operational safety.
What the solution delivers:
Structured Navigation: Experience an intuitive journey scaling from a fleet overview down to component-level details (motors, gearboxes, and the drum)
Expert Metrics: Track essential indicators such as Toe and Shoulder angles and energies, essential for evaluating the grinding regime and liner wear.
Dedicated Visualization: Analyze asset behavior through temporal trends and the energy polar chart, correlating vibration with the actual ball impact position.
The Key Differentiator: AI Health Summary
The platform automatically processes metrics and fault detection to deliver a dashboard featuring the overall asset status, findings, and recommended actions. This transforms complex data into a clear diagnosis, enabling quick decisions without the need for exhaustive manual analysis of every chart.
_________________________________
2. PIMS Connector: Integrating Process Data into Dynamox
Dynamox now features the PIMS Connector, a functionality designed to map tags from your PIMS directly to platform spots.
This integration empowers operators to analyze multiple PIMS variables within a single environment alongside existing Dynamox data. It eliminates the need for re-instrumentation, leveraging an intuitive and user-friendly interface.
How it works:
Integration setup via connector interface (Administrator profile)
Mapping PIMS tags to corresponding spots
Automatic data synchronization post-configuration
The connector supports two synchronization modes. Choose the optimal model for your operation: To ensure this integration complies with your site’s network and data policies, you can choose between two options:
Periodic Synchronization: The Dynamox platform automatically retrieves information from the PIMS at scheduled intervals.
On-Demand Delivery: Ideal for those who prefer to manage the outbound data flow. In this model, data is transmitted via the connector API, enabling your team to define update frequencies on the platform based on source system availability and operational needs.
Note: In the second option, it is important to highlight that the responsibility for the data connection frequency will depend on how often your team sends data to the Dynamox API.
To get started, access Administration > Connectors > PIMS and click on “Request connection”. Following the request, our commercial team will reach out to proceed with contracting and activation. ___________________________________
3. AI Operating Level Suggestion
Dynamox now leverages Artificial Intelligence to automatically suggest asset operating levels, making the configuration more accurate and reliable.
The feature analyzes the spots history and suggests the ideal value to differentiate between running and stopped machines — an essential factor for the quality of indicators and analysis.
Practical benefits include:
Enhanced accuracy for hour meters and condition indicators
A reduction in false alarms caused by data collection on stopped machines
Increased consistency in spot configuration
The system automatically generates this suggestion for spots with a minimum of 15 consecutive days of data. Users can review it directly in the Spot Center, under the Operating level settings.
Once defined, the platform will:
More accurately identify the asset status
Ignore data collected during downtime in the analysis
Ensure greater reliability in indicators and diagnostics
Make sure to review your vibration monitoring points and check the suggestions to keep your Dynamox platform optimized for daily operations. ________________________
We designed these enhancements to make your monitoring more intuitive and efficient, contributing to a clearer and more agile daily operation.
Do you have any questions or want to learn more about these updates?
Stay up to date with the latest features and enhancements we’ve just launched on the Dynamox Platform.
Check out what’s new and leverage these updates to their fullest! ___________
As part of our continuous improvement cycle, the latest updates focus on increasing the robustness of automated monitoring and improving maintenance team’s planning capabilities.
Below, we outline the key implementations on the Dynamox Platform.
Asset Expansion in DynaDetect: Greater flexibility for your plant
We understand that each industrial facility has a diverse machine park and unique processes. To address this reality, we have significantly expanded the library of assets covered by DynaDetect.
Benefits for you: More than 50 new assets have been added and can now be monitored using Dynamox’s automatic detection intelligence. This expansion aims to continuously broaden plant-wide monitoring, regardless of asset type. This is Dynamox intelligence adapting to your operational needs. __________
Future Cycle Visualization in the Analysis Plan Now, within the Analysis Plan, in addtion to managing routes, ongoing plans, and historical data, it is also possible to preview the future cycles planned by the platform.
Benefits for you: This feature increases operational predictability, enabling better organization of resources, tools, and workforce. It also helps mitigate the risk of monitoring discontinuity for critical assets and strengthens adherence to the maintenance plan.
These improvements are not merely functional; they are designed to reduce operational management effort. While DynaDetect operates at the scale of diagnostic intelligence, Future Cycles focus on structuring and optimizing your field routine.
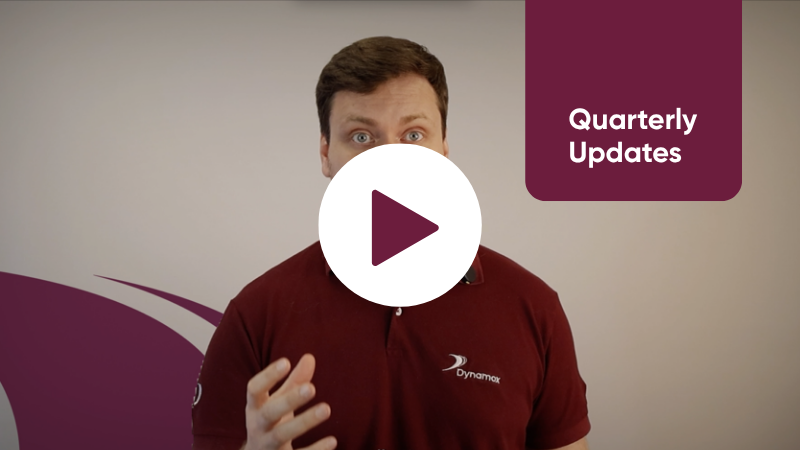
Every quarter, Dynamox evolves alongside your operation. To keep you fully up to date, we have prepared a special video highlighting the latest features recently released on our platform.
Click here to watch the video and discover everything we’ve prepared for you!
In the video, you’ll learn about:
Expanded telemetry coverage
Monitoring now ranges from 3 Hz to 13,000 Hz, enabling effective monitoring of low-speed assets. This expansion delivers broader coverage, increased safety, and even more accurate diagnostics.
Analysis Plan
No more manual tracking in Excel spreadsheets or notebooks! With the new Analysis Plan, analysts can view all routes and analyses to be performed on a single screen. Routes are automatically opened for recurring assets, and managers can track progress in real time while also generating comprehensive process reports.
Automatic rescheduling of spectral data collection
The system now automatically identifies whether the machine is operating, preventing unnecessary data collections, and optimizing the team’s time.
Management KPIs in the Dynamox App
Key performance indicators are now available in real time directly in the app. Simply select the desired module from the home screen to access all relevant information; anytime, anywhere.
Simplified asset registration and organization
Asset registration in the Asset Tree is now faster and more intuitive. You can create multiple machines at once and easily reorganize them by dragging them and dropping into the desired position.
Asset list with 3D images
Asset visualization is now even clearer and more intuitive, with 3D images that make it easier to identify assets and monitor inspection points and pending alerts.
New gateways dashboard
Visually track gateway status with connectivity icons and detailed information such as connection type, serial number, associated device status, firmware version, and more. Enjoy greater visibility and operational control across the entire DynaGateway network.
Take the opportunity to explore these new features; and if you have any questions or would like to discuss how to further maximize your use of the Dynamox Platform, feel free to contact our team!
Count on Dynamox to continuously evolve your asset monitoring.
Stay up to date with the latest features and enhancements we’ve just launched on the Dynamox Platform.
Check out what’s new and leverage these updates to their fullest!
_____________________
1. New feature: Machine type selection now includes 3D images
Asset identification on the Dynamox Platform is now easier. When selecting an asset type, you can now view a 3D image of the equipment directly in the selection list. This improvement is available across the entire platform, wherever asset selection is required.
Examples from two different locations:
Machine Center:
Or directly from the asset tree, for example.
This change aims to reduce asset configuration time by improving equipment recognition. ____________________
2. New feature: Centralized view of pending alerts in inspection indicators
To further simplify your daily routine, we’ve added a new chart to the Inspection Indicators page. It provides a consolidated view of assets with active alerts, making it easier to quickly identify inspection points that require attention. From the same screen, you can view the checklist, the type of pending issue, and the related response.
How to access and use it:
Access the Dynamox Platform as usual.
In the menu, click on Inspection Indicators.
Locate the new Pending Alerts chart at the bottom of the page.
Click on the items to view details and plan your next actions.
This improvement was designed to bring more visibility, control, and practicality to your inspection process, making alert management far more efficient.
___________________________
3. Update to the Online Gateways Screen
On the Dynagateways screen of the platform, it is now even easier to manage your fleet and monitor the connectivity of your Dynagateways. This information is displayed in the connectivity column, through an icon that indicates the connection type (Wi‑Fi, Ethernet, or Mobile Networks). If the icon is green, the Dynagateway is online. If it appears as ‘disabled’, the Dynagateway is offline.
A gateway is considered online only if it has sent a status update or any measurement within the last 6 hours. When you hover over the icon, a tooltip displays the date and time of the last connection.
Additionally, the screen includes new summary cards that display:
Total Dynagateways in the selected workspace
Number of online gateways
Number of offline gateways
Total associated spots
Now, the Dynagateways you search for are saved in your browser, making future lookups easier (this information is user‑specific and only visible to you in that browser).
Filtering is not yet available, but in the next quarter we will introduce filters and more detailed information. Another new feature allows you to pin up to 5 Dynagateways as favorites, enabling quick access to the most important ones.
You can also access additional options, such as data collection settings (trigger configuration and stopped‑machine rescheduling).
These improvements make gateway monitoring more practical, visual, and efficient in your day‑to‑day operations.
Stay up to date with the latest features and enhancements we’ve just launched on the Dynamox Platform.
Check out what’s new and leverage these updates to their fullest!
____________
New: Machine movement in the asset ree
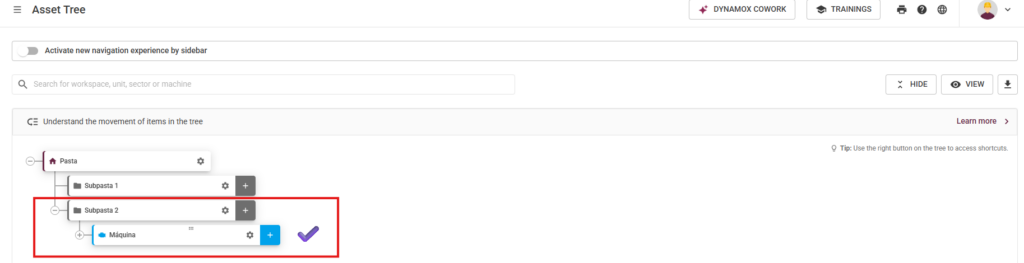
It is now much easier to reorganize your asset structure in the Dynamox Platform. With the new feature, you can move machines between folders in the Asset Tree quickly and easily, just as you already do with Spots. Simply drag the machine to the desired folder and you’re done: the platform automatically records the movement, updating your monitored plant structure in real time. There’s no need to fill out forms or contact support, you now have full autonomy to organize your assets according to the needs of your operation.
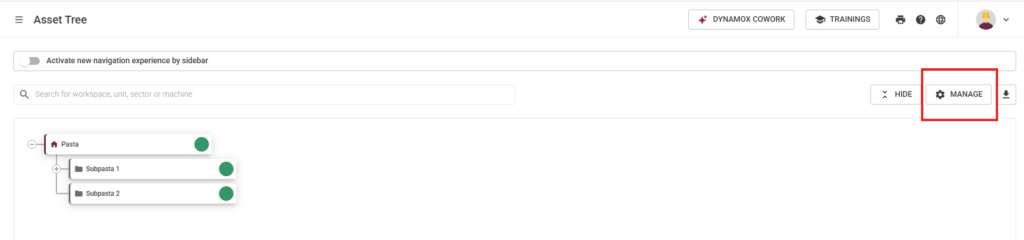
Step-by-Step: 1. Once inside the platform, access your asset tree and click on “Manage“.
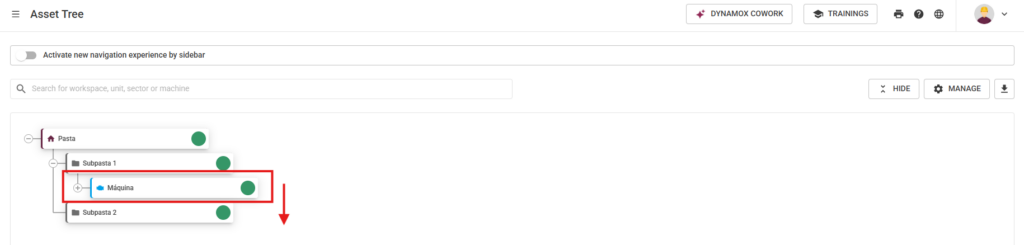
2.Select the machine you want to move.
3. Click and drag the machine to the desired folder.
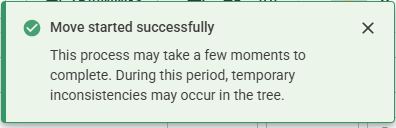
4. The movement may take a few seconds depending on the asset’s complexity. You will receive a notification that the movement has started, and once complete, your machine will have been successfully moved.
This improvement is designed to make your routine more agile, reduce time spent on administrative task, and boost your operational efficiency. Additionally, by making it easier to reorganize assets, you gain more flexibility and control over your plant management.
Key benefits for you:
More autonomy to organize machines and folders
Reduced time and effort to keep the Asset Tree up to date
Less dependence on Dynamox support for movements
A more intuitive and efficient platform
Try it now and see how managing your assets can be even more practical with Dynamox!
____________________________
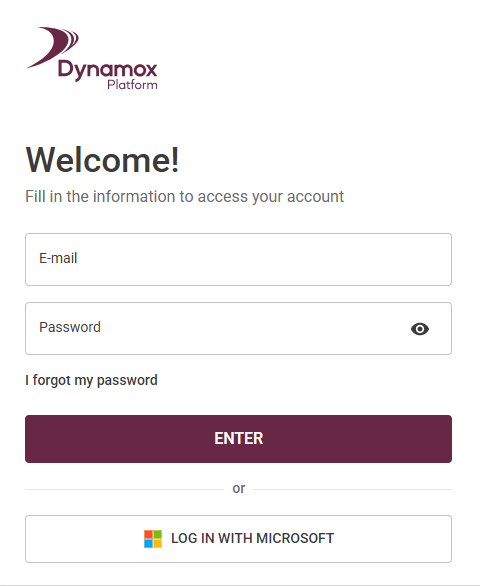
New: Microsoft SSO login available for all plans
To make access even easier while reinforcing information security, Dynamox now offers Microsoft Single Sign-On (SSO) login for all users — including those on the standard plan.
With this update, you can access the Dynamox Platform using your corporate Microsoft account, without needing to create or remember another password. Simply click “Sign in with Microsoft” and, if you’re already authenticated in Microsoft, access is immediate.
Key benefits for you:
More convenience: fast access, with no need for a dedicated Dynamox password.
More security: reduces the risk of password leaks and centralizes access control in your company’s IT team.
Less hassle: no more worrying about recovering or managing multiple passwords.
Traditional password login remains available, ensuring flexibility for all users.
This enhancement reinforces Dynamox’s commitment to security and customer experience, making platform access simpler and more protected.
____________________________________
New: Analysis plan execution reports
Tracking progress and operational discipline across your analysis plans is now much easier on the Dynamox Platform. With the new Reports feature, you gain access to a true logbook of each plan cycle, offering greater traceability and transparency in your monitoring process.
Step-by-Step:
1. A new “Reports” button is available directly on each analysis plan card.
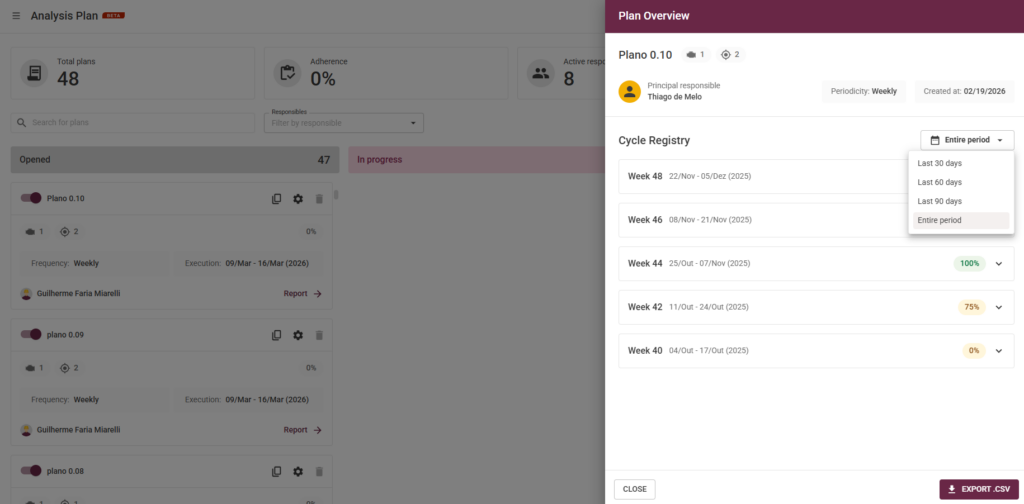
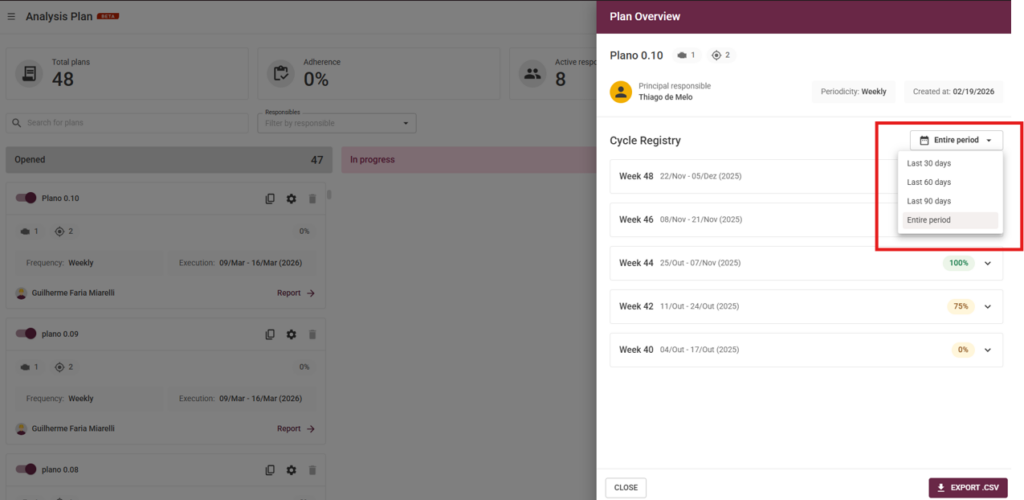
2. Inside, you can view the full history of plan executions, including details such as: responsible user, frequency, creation date, total assets, and monitored spots.
3. Execution cycles are displayed in a list format with a period filter (last 30, 60, 90 days, or full history).
For each week, adherence rate (completion percentage) is automatically calculated based on the reports issued — including cases where one report covers multiple spots.
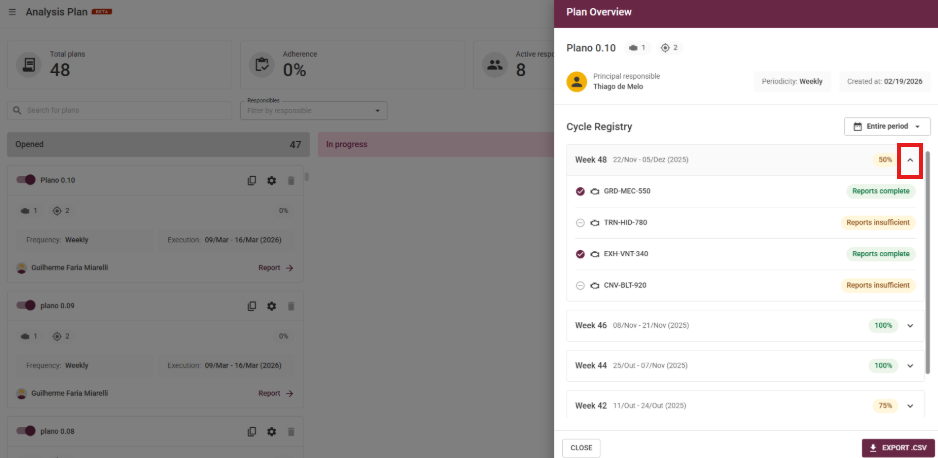
4. By expanding each week, you can see the status of each machine: which were inspected and which are pending, with visual check markers.
Progress can reach 100% once all required reports are entered, enabling the “Mark as analyzed” button. Closing the cycle, however, is always a manual action performed by the user, ensuring full control over final validation.
Key benefits for you:
More transparency and traceability when tracking analysis plans
Easier identification of bottlenecks, pending tasks, and improvement opportunities
Detailed historical records for audits, compliance, and technical quality assurance
Clear visualization of progress by machine and by cycle, supporting better management and decision-making
These improvements were designed to make your monitoring workflow more intuitive and efficient, contributing to a faster and clearer operation in your day-to-day activities.
If you have questions or want more details about any of these updates, talk to our team!