Web: August 2 | 2026

Hello,
Stay up to date with the latest features and enhancements we’ve just launched on the Dynamox Platform.
Check out what’s new and leverage these updates to their fullest!
Mass Asset Configuration
Previously, defining type, manufacturer, model, risk class, and business risk required opening one asset at a time. At scale, configuring thousands of assets was unfeasible.
To streamline this, we have released Mass Asset Configuration, now available on the new Assets page.
Why it matters
Type and risk classification are not just registration fields. They drive coherent asset prioritization and the reliability of platform insights. Untyped assets participate less in analysis, meaning a configuration gap can quickly become a diagnostic gap.
What changes in practice
- Scale — up to 1,000 assets per operation in a single run.
- Standardization — similar assets no longer diverge due to manual entry differences.
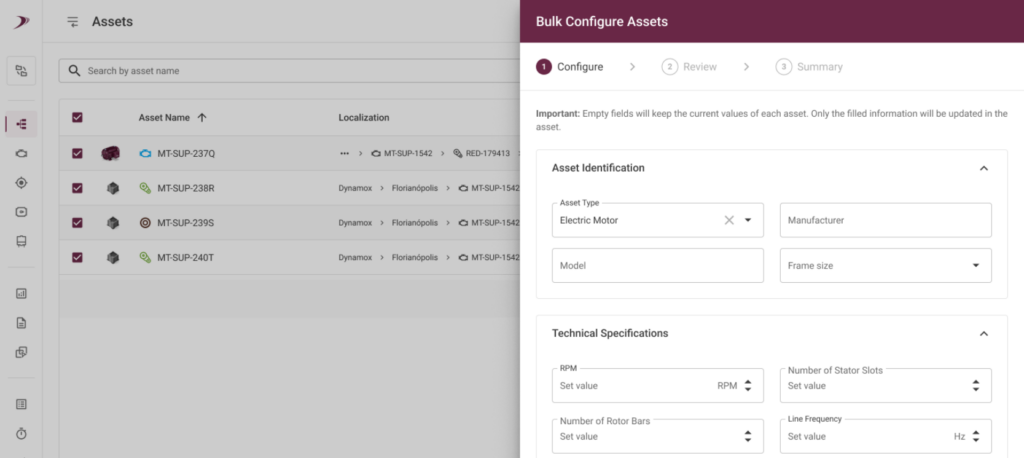
- Depth — when a type has specific technical characteristics, they are included in the bulk update. Example: Selected an electric motor? Configure the number of rotor bars and stator slots for all of them at once.
- Reliability — each asset is processed individually. If one fails, the others proceed, allowing you to retry only the pending ones.
How to use it
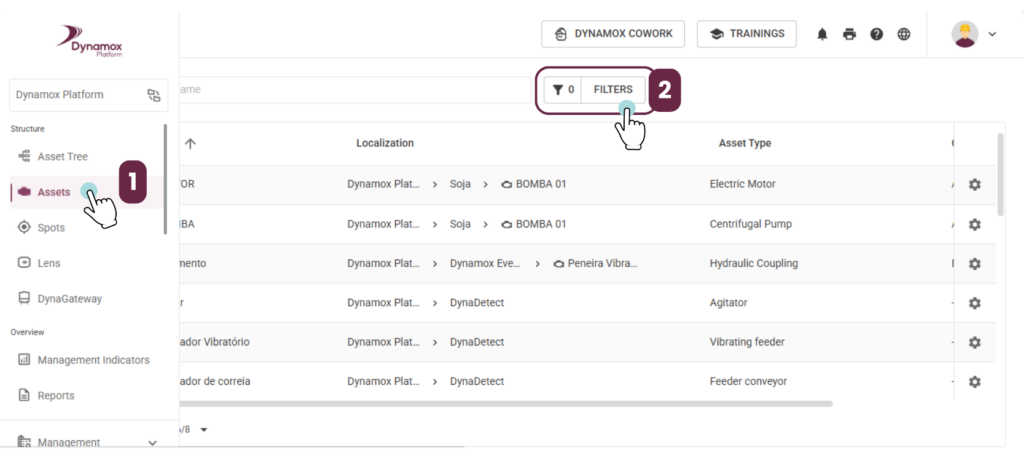
- In Assets, filter what you want to configure. Filter by “no type” to spot exact gaps, or search by name.
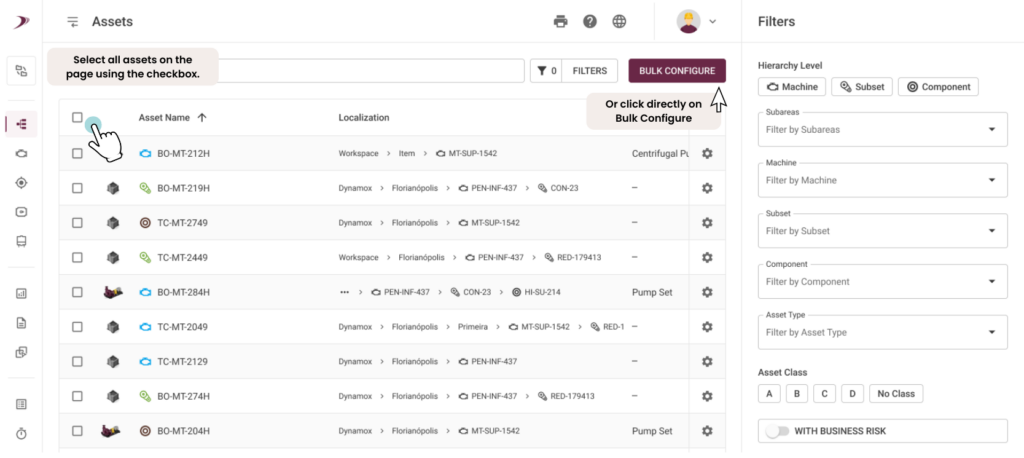
2. Select the assets or go directly to Mass Configuration (the first 1,000 are automatically selected).
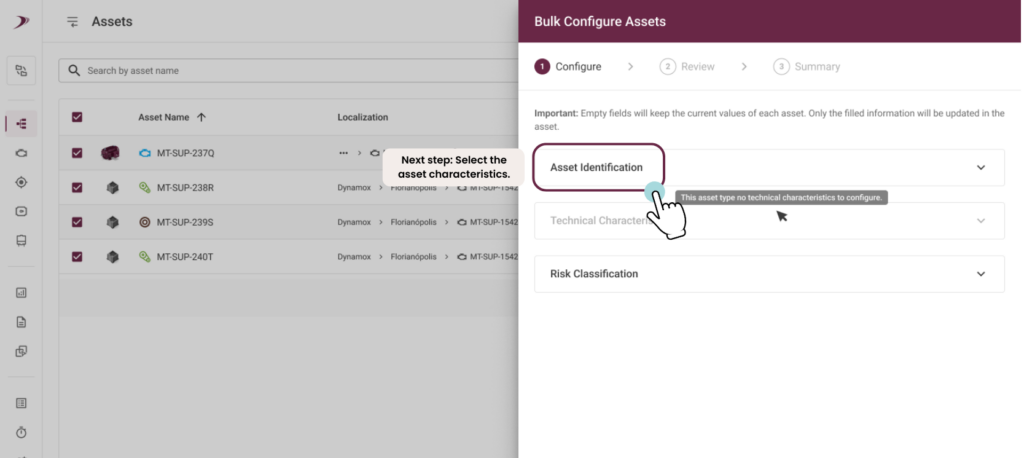
3.Define the batch data: identification, technical characteristics, and risk classification.
4.Fill in the details, review the summary, and confirm.
5. Once saved, you can move on to the next batch.
Best time-saving practice: group only assets with the same configuration goal. A purpose-driven batch yields better results than a large, mixed one.
Why is this update important?
In the new Decision Making Assistant (DMA), the GUT matrix prioritizes your assets and pinpoints where maintenance should act first. To leverage this prioritization, assets must be correctly classified with populated criticality, business risk, and other attributes.
Configuring this data ensures the platform receives the necessary inputs, empowering you to unlock the full potential of GUT prioritization.
Previously, entering this data meant opening one asset at a time. Now, you can classify dozens of assets in a single batch operation.
The result: less manual work, a streamlined environment setup, and a consistent foundation for the GUT matrix to deliver more accurate prioritizations.
PDF Reports and Image Downloads in Thermal Viewer
From now on, the Dynamox Lens Thermal Viewer generates a thermography report directly within the platform.
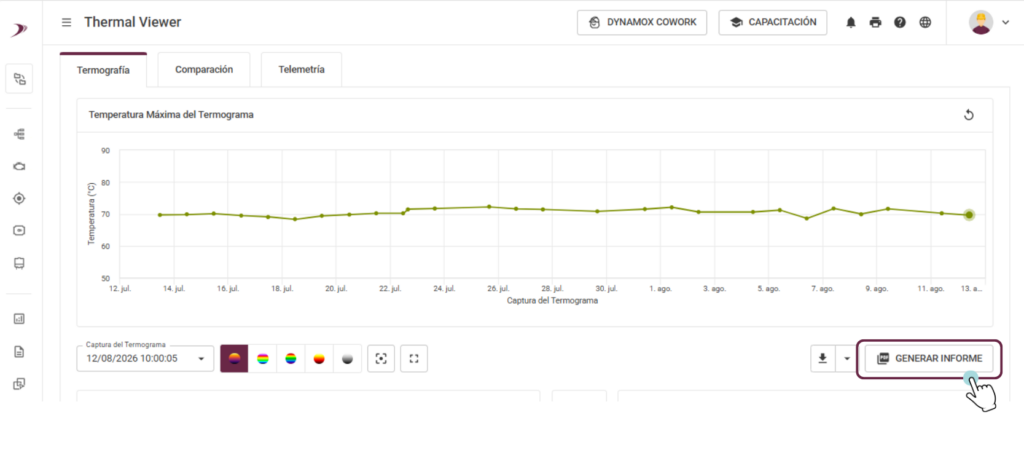
What changed?
A new report generation button in the Thermal Viewer opens a modal where you can configure exactly what needs to be documented:
- Capture period
- Thermogram color palette
- Regions to include in the analysis
- Mode: thermogram, visible light image, or both
- Annotations and temperature scale: include or exclude
Clicking Export automatically generates and downloads the formatted PDF.
Plus: image downloads
Beyond the report, you can now download individual thermographic images for presentations, comparisons, or your own report templates.
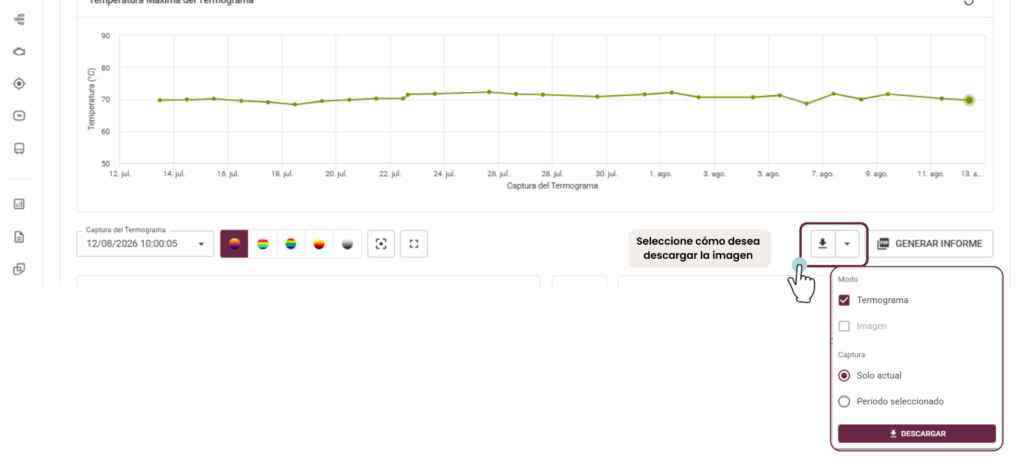
Selecting “Selected Period” generates a ZIP file with multiple images. Choosing “Thermogram + Image” downloads both images in the same file.
What does this change in practice?
Inspection evidence ready to attach to reports, with no layout revision needed
Less operational time spent on internal reports
Real monitoring traceability, featuring exportable documents with automatic asset and date identification
This feature is already live and available in the web flow for any configured Dynamox Lens.
Audio Download in Spectral Viewer
Download the vibration audio measured by the Spot and track equipment condition over time.
It is now possible to download the audio generated from the vibration measured by the Spot. This transforms what was once a transient on-screen sound into a permanent record, documenting exactly how the equipment behaved when an anomaly was identified.
Audio is no longer just an impression; it becomes archivable, comparable, and transferable evidence across teams.
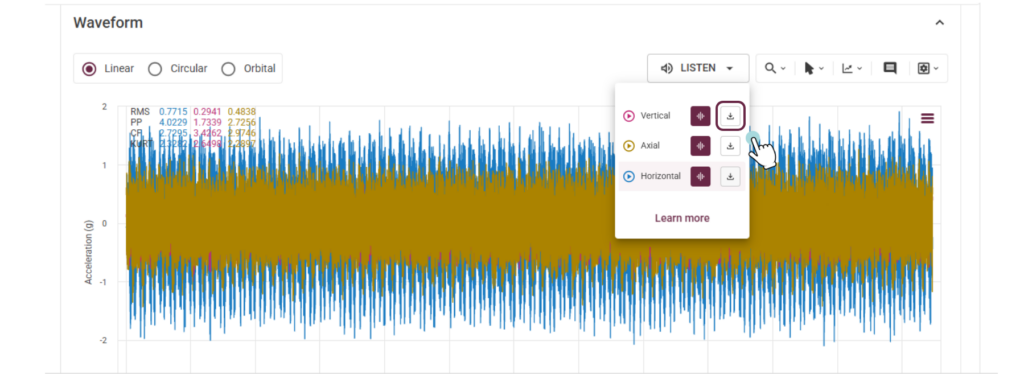
What changes in practice?
On-the-spot recording. Save the audio from the exact moment a deviation appeared, alongside the spectrum and waveform from that instance.
Before and after interventions. Download the audio from the same point post-repair and compare. It provides a direct way to demonstrate maintenance results—whether to operations, leadership, or the execution team.
Beyond the platform. Attach it to technical reports, leverage it in critical analysis meetings and presentations, or share it with another analyst for a second opinion.
Details
- Downloads are generated as separate files for each axis.
- Exported in WAV format, compatible with standard media players and audio analysis software.
This feature is already available in the Spectral Viewer.
Asset Tree Redesign
The Asset Tree has been redesigned to make asset registration and editing simpler and more intuitive.
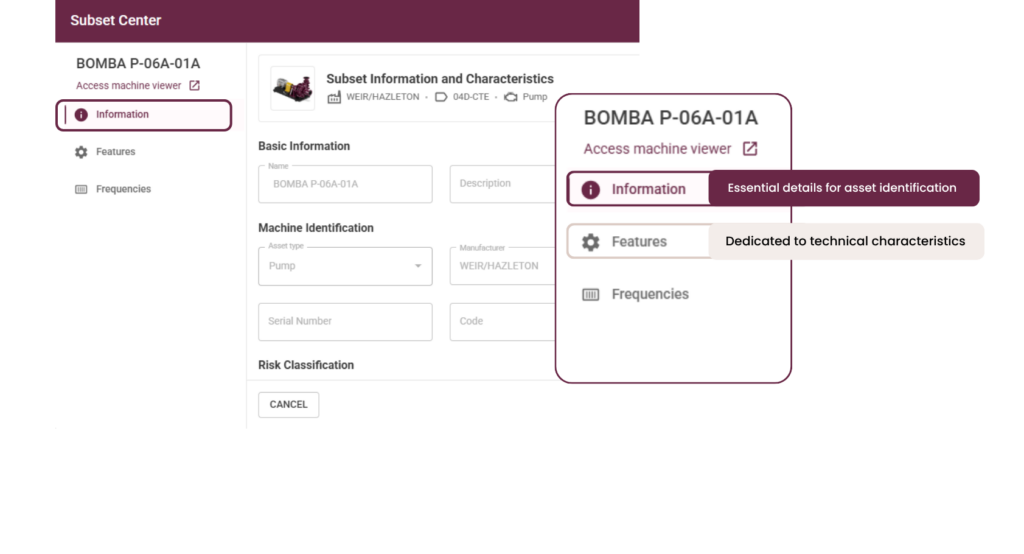
Previously, general and technical information were combined in a single form, making data entry tedious. The process is now divided into two clear steps:
- Information — asset type, risk class, business risk, and other data common to any asset.
- Technical Characteristics — displayed only when the selected asset type has specific technical fields.
This new structure streamlines the flow. First, you fill in what is common to all assets, then move on to the technical details.
The result: faster, more consistent, and easier-to-review registrations.
These improvements were designed to make your monitoring more intuitive and efficient, contributing to a more agile and clear operation in your daily routine.