Web: July | 2026

Hello,
Stay up to date with the latest features and enhancements we’ve just launched on the Dynamox Platform.
Check out what’s new and leverage these updates to their fullest!
___________________________________
Conveyor Belts: End-to-End Monitoring
Asset Pro has taken a leap in Conveyor Belt monitoring. Now, beyond monitoring the drive and pulleys, it delivers total visibility over the conveyor structure: the Idler Frames and Rollers.
- Complete System Overview: Users can now configure loading, impact, and return idlers directly on the platform. This enables the actual belt structure to be represented within the system, ensuring management stays true to field reality.
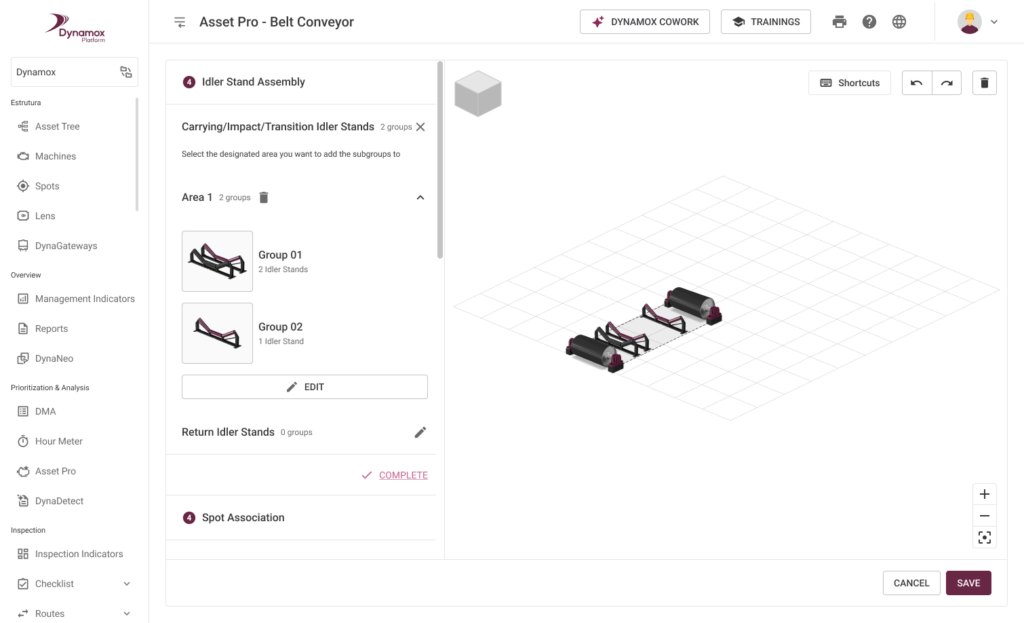
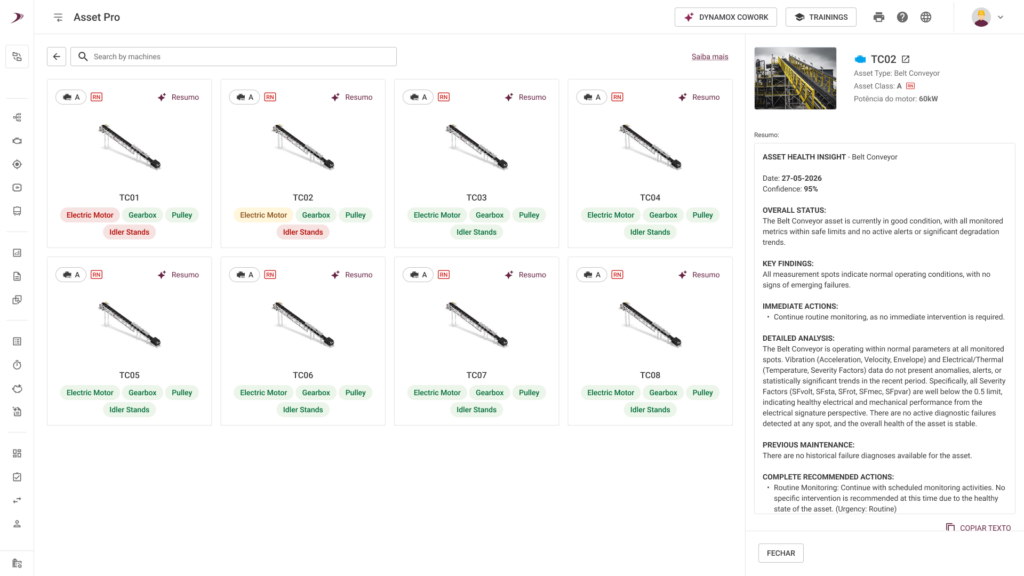
• Roller Health in the Conveyor Belt list: A new status indicator for rollers automatically appears in the list whenever the conveyor belt has configured idlers. This streamlines the triage of multiple conveyors without the need to open each dashboard individually.
- Heat Map for Prioritization: No more spot-by-spot analysis. The new heat map empowers users to visually identify critical sections of the belt. Colors indicate alert severity along the entire extension, directing the maintenance team exactly to where action is needed.
- Intelligence with Dynamox Cowork: Dynamox Cowork can generate AI-curated insights, providing an automatic summary of the equipment’s status.
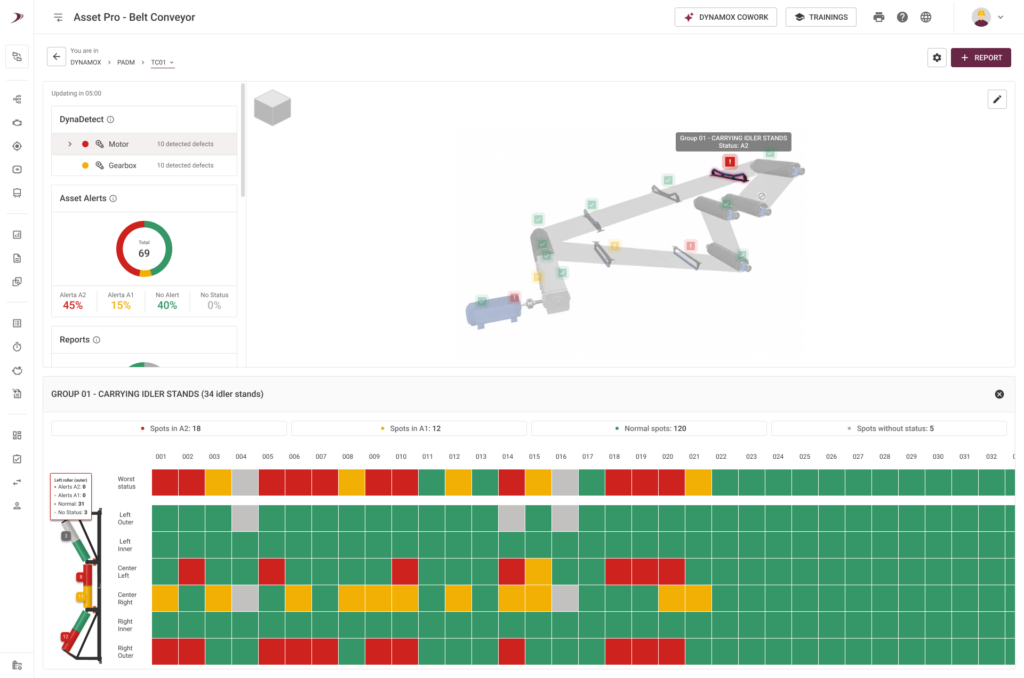
- 3D and Reports Integration: Idler frames are now part of the complete experience. They appear in the 3D model with status information and are integrated into the reporting workflow, ensuring full traceability of inspections across the entire conveyor.
The real benefit: It empowers you to manage the conveyor as a complete system. The Heat Map drastically reduces triage time, transforming hundreds of sensors into strategic visual data that optimizes your maintenance efforts.
Note: In this phase, idler and roller monitoring focuses on temperature and vibration telemetry, while automated fault detection (DynaDetect) remains available for Motors, Gearboxes, and Pulleys.
_________________________________
Total Traceability: Last Report Update Date on the Reports Dashboard
To streamline the analysis workflow tracking and ensure the most recent data is always at hand, we have added the last report update date directly to the dashboard.
- Immediate Visibility: Now, the main screen of the Reports Dashboard features a dedicated column showing exactly when each report was last updated. This enables quick identification of which assets have recent analyses and which might need a new review.
- Streamlined Prioritization: This new visual information empowers operation and maintenance teams with the agility to prioritize checks and alignments, driving efforts to where the analysis is most critical or has been outdated for the longest time.
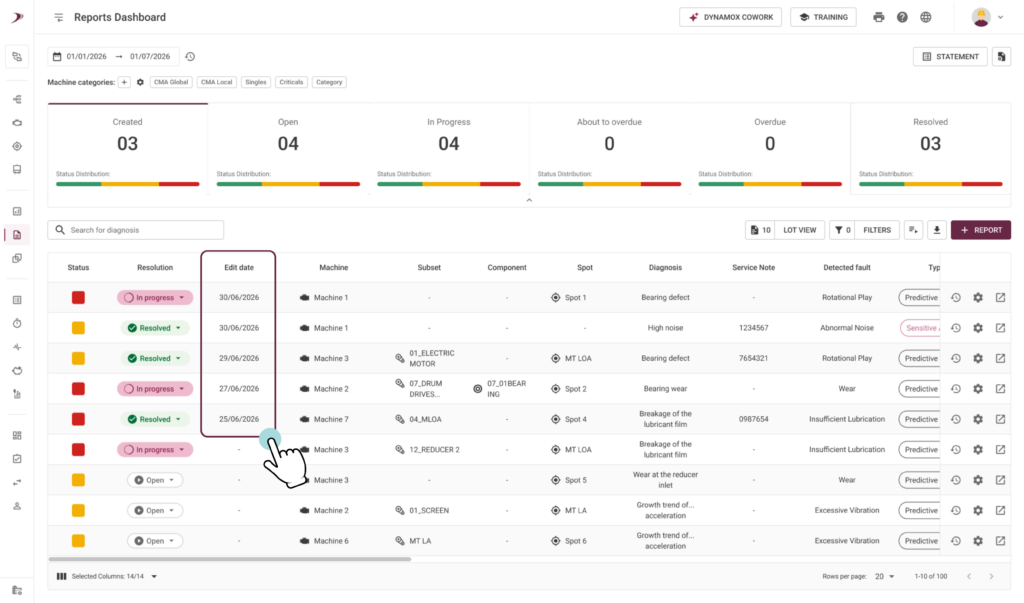
- Consistent Data: This information has also been included in the CSV export, ensuring the last analysis date follows the asset’s history even in external reports or BI tools.
The real benefit: It delivers total control over the recency of your analyses. This transparency eliminates doubts about a diagnosis’s validity and accelerates decision-making, ensuring maintenance is consistently driven by updated and reliable data.
These improvements were designed to make your monitoring workflow more intuitive and efficient, contributing to a faster and clearer operation in your day-to-day activities.
If you have questions or want more details about any of these updates, talk to our team!
Until next time!
Dynamox Team