Web: September 2| 2026

Hello,

Stay up to date with the latest features and enhancements we’ve just launched on the Dynamox Platform.

Check out what’s new and leverage these updates to their fullest! 


1. ASSET HIBERNATION 

Every machine now has an operational state: In Operation or Hibernated. When a piece of equipment is temporarily out of service, whether because of redundancy, low demand, planned maintenance, or seasonality (such as harvesters in the off-season), you can flag that context on the platform by setting its status to “Hibernated”. 

Hibernating is not shutting down. The asset stays on the platform, its history stays intact, and monitoring resumes automatically when it returns to In Operation. 

What does this change in practice? 

  • While the machine is hibernated, it does not generate new alerts or trigger alert emails. 
  • In Management Indicators, hibernated assets are left out of the calculations. 
  • In DynaSens, they are not added to new inspection routes and are flagged in the asset tree. 
  • In DMA, only assets in operation are shown, but you can still view hibernated items. 
  • In Machine Viewer, the asset is flagged as hibernated, and you can change its state by opening the Machine Center. 
  • In Spot Viewer, switching to the hibernated state changes the status of all alerts to disabled. 
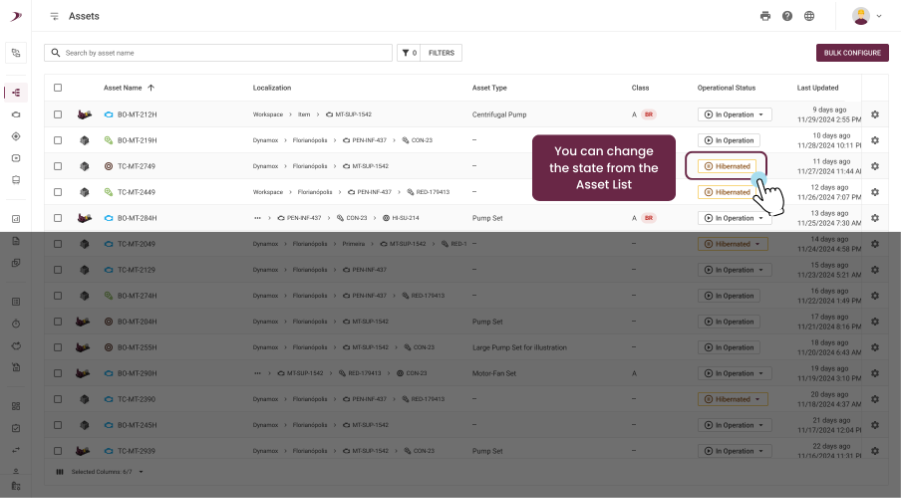
Every state change becomes an event on the asset timeline, with author, date, and time. 

✅ For analysts, the work queue now contains only assets that are actually running. 
✅ For managers, indicators reflect the plant’s real operation again. 

You can make the change in the Machine Center, from the Asset List, or with Bulk Asset Configuration to update many assets at once. 

Who can make changes? Administrator and Editor profiles. Reader profiles have view-only access. 

Important: sensors keep measuring and DynaGateways keep collecting data as usual. Hibernation is an operational flag, not a hardware shutdown.


2. DYNAMOX LENS: TIME LAPSE IN THERMAL VIEWER 

Thermal Viewer gets the new Thermal Evolution tab. It plays back the thermograms already stored for the selected period as a video, synchronized with trend charts. On your first visit, a guided tour introduces the feature. 

What does this change in practice? 

Instead of opening thermograms one by one and comparing them from memory, you watch the asset’s thermal evolution continuously. 

The player includes play, pause, step forward and back one capture at a time, speed control, free navigation with the slider, and the date and time of each capture on screen. Subtle heating trends, exactly the ones that signal a failure is coming, become visible.
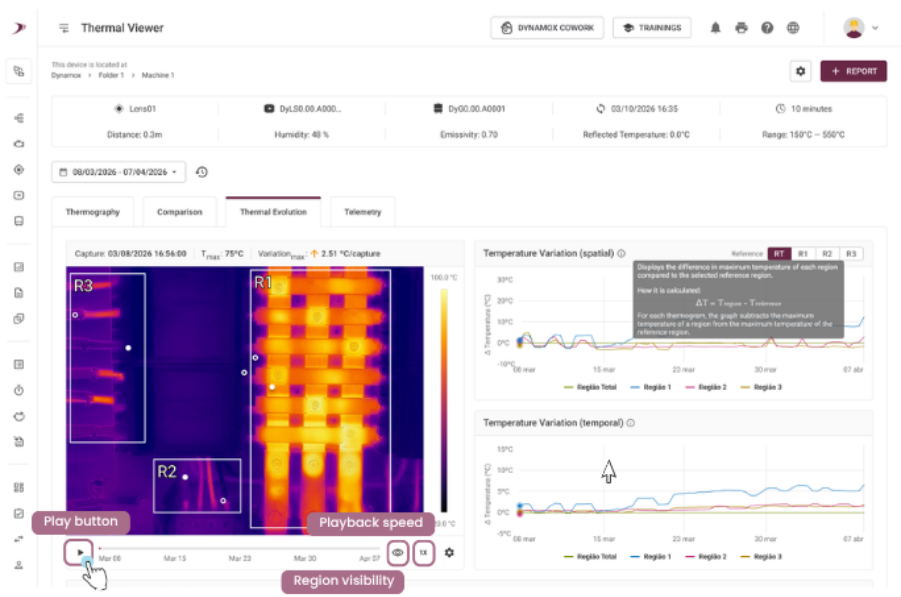
Three charts quantify what the time lapse shows: 

  • Maximums and Minimums by region, showing each region’s temperature range over the period. 
  • Imbalance between regions, which compares each region’s maximum temperature with the median of the other regions’ maximums, capture by capture. A positive value means a region is hotter than the others, a possible hot spot. A value close to zero means normal behavior, and a negative value means a cooler region. 
  • Maximum temperature variation, showing the difference between the current capture and the previous one, by region. 

Each chart explains how it is calculated and what it’s for, and you can filter which regions to display. 

Synchronization works both ways: playback moves the points on the charts, and clicking a point on a chart jumps the video to the capture behind that data. 

For maintenance analysts and thermography technicians, the gain shows up in the daily routine. Screening an entire period now takes a playback of just a few seconds instead of opening and closing thermograms one by one. That frees up time to cover more assets in the same work window. 

Important: the Time Lapse is built from thermograms already stored and does not take new captures. The period needs at least 2 captures, up to a maximum of 60. 


3. ASSET PRO: GRAIN ROLLER MILL 

We’ve expanded our Asset Pro portfolio, which now includes an expert view for a critical asset in agribusiness: the Grain Roller Mill. 

This release was built around the most important decision for this equipment: when to stop and regrind the rolls. By tracking wear through trends instead of one-off readings, the team schedules regrinding based on evidence, which means higher asset availability and more technical support when deciding on an intervention.
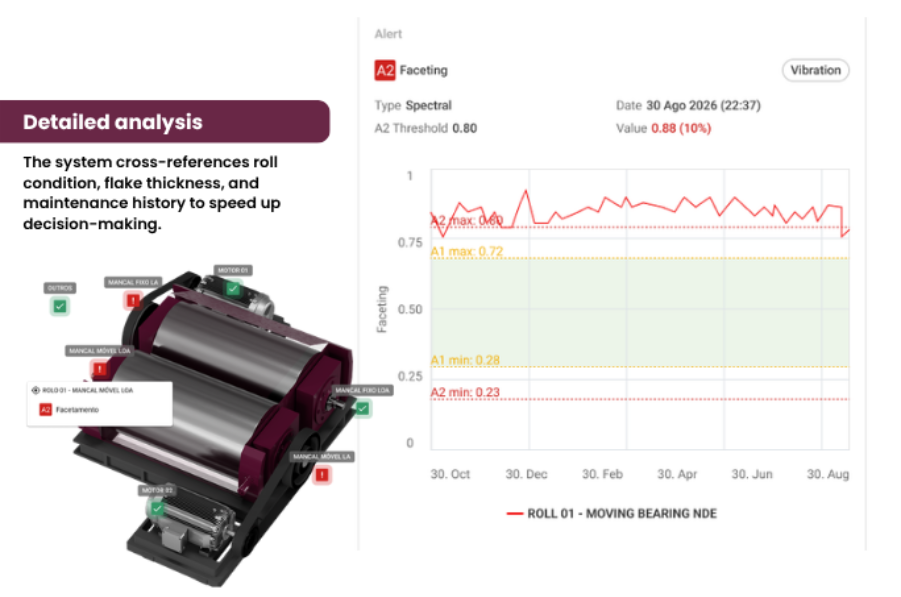
How does it work in practice? 

Asset Pro Grain Roller Mill gives a consolidated view of the asset. This reduces the risk of unplanned downtime, preserves operational quality, and helps teams do maintenance at the right time. 

Expert metrics track roll faceting and behavior through trends. This is what supports regrinding at the right time, not too early and not too late. 

Autocorrelation compares behavior across points and sides of the assembly, which is useful for misalignment and repetitive patterns. DynaDetect provides automatic diagnostics for the equipment’s typical failure modes, and the AI summary sums up the asset’s condition in text, ready to share clearly across maintenance, reliability, and management.


4. REPORTS THAT ARE EASIER TO FIND AND CREATE 

The reports journey has four improvements focused on traceability and productivity. 

What’s changed? 

✅ The report list now shows each report’s unique ID, and you can search directly by that ID. 

✅ The table also gets a Location column, showing the asset’s path in the hierarchy. Both fields, ID and Location, also appear in the exported CSV and in the generated report, which makes audits easier. 

✅ A new filter by monitoring technique, such as Vibration and Thermography, lets you narrow the list to fit the analysis you’re working on. 

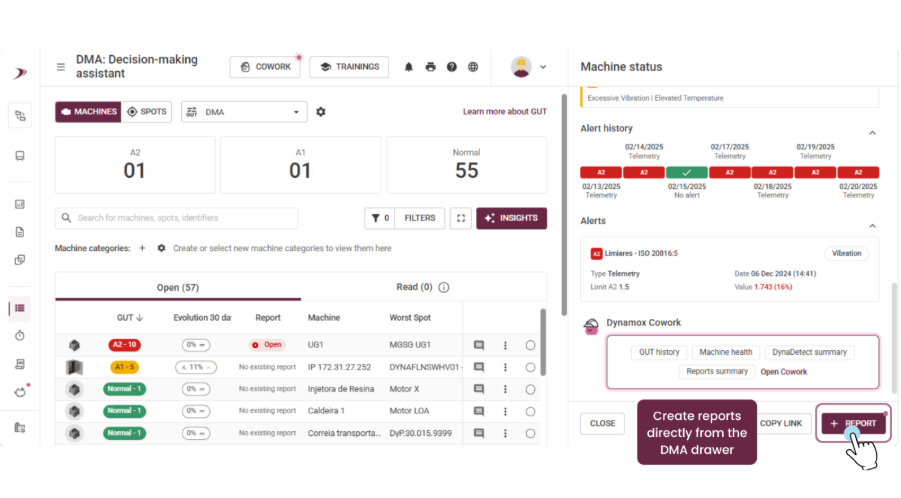
✅ The point and machine drawer in the GUT view, within DMA, now has a quick action button for creating a report. You can start the record without leaving the analysis, and it stays linked to the point or machine you’re evaluating. 
5. DYNAMOX COWORK WITH CONTEXT IN YOUR QUESTIONS 

In the Dynamox Cowork chat, you can now point to a specific Spot or machine (including subassemblies and components) to give the Coworkers more context. 

When you type @ in the question field, you can search for and select a spot, machine, subassembly, or component to add context to your question. 

The Coworkers use the selected item as context to give you a more relevant answer.

These improvements were designed to make your monitoring more intuitive and efficient, contributing to a more agile and clear operation in your daily routine. 
Web: September | 2026

Hello,

Stay up to date with the latest features and enhancements we’ve just launched on the Dynamox Platform.

Check out what’s new and leverage these updates to their fullest! 


Platform 

1 – Asset Pro Conveyor Belt: 5-Roller Idler Frame Support 

To accurately represent larger conveyors, Asset Pro Conveyor Belt now natively supports 3- and 5-roller idler frames. 

What Changed? 
Configuring a 5-roller idler frame unlocks four new monitoring positions on the platform, accounting for two monitoring points per roller. 

Configuration Flexibility 
Configuration is handled individually for each idler frame, enabling 3- and 5-roller frames to coexist on the same conveyor belt. 

Guaranteed Compatibility 
Existing idler frames remain unchanged. Monitoring points, measurement history, and operational data are fully preserved. 

Value Delivered 
The new configuration expands monitoring coverage for large-scale conveyors, streamlining point tracking directly within the platform. 
Enhanced visibility into roller conditions empowers teams to detect problems with pinpoint accuracy, mitigate operational risks, and optimize maintenance planning—all without altering previously configured structures. 


2 – Linking Alerts to Reports 
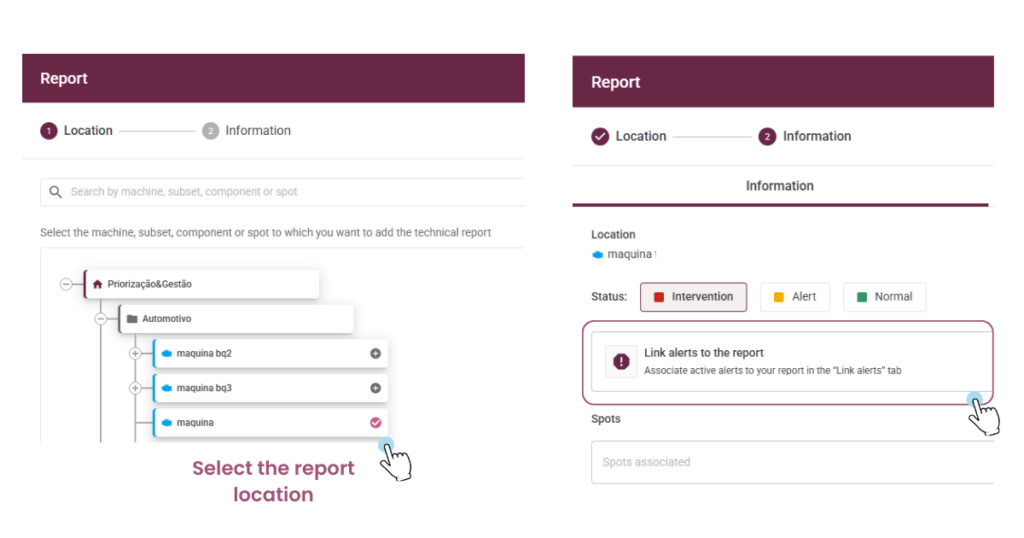
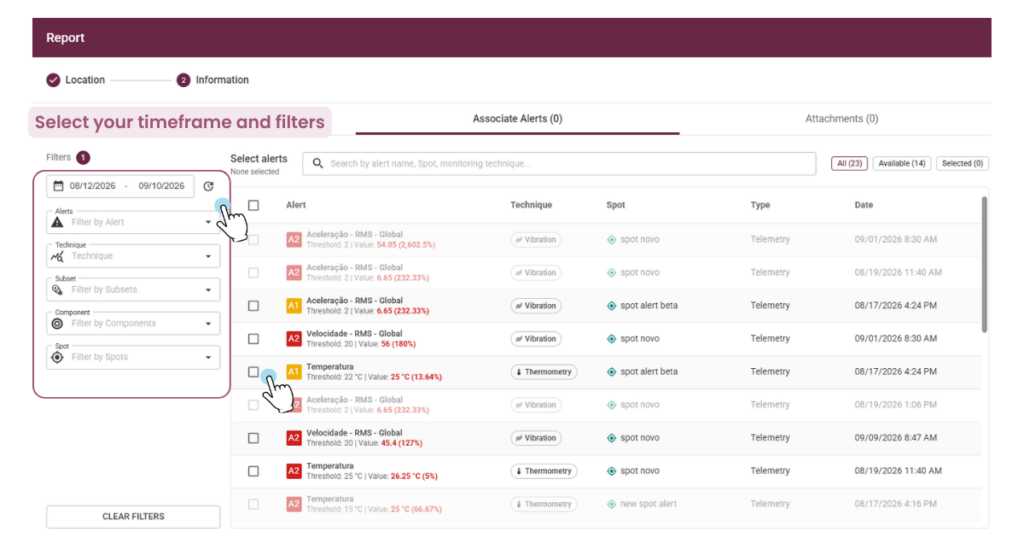
Creating or editing a report now includes a new step called Associate Alerts, seamlessly integrated right after location definition. 
Users can select the A1 and A2 alert events that triggered the report across any hierarchy level: machine, assembly, or spot.

The Practical Impact 

  • It establishes a formal traceability trail connecting anomaly detection directly to the action logged in the report. 
  • Each event displays comprehensive data: policy, date and time, level, threshold, measured value, spot, and monitoring technique. 
  • The monitoring technique triggering the alert, such as Vibration or Thermometry, auto-populates based on the selected alerts. 
  • The list filters by date, level, technique, subassembly, component, and spot, driving a more efficient analysis. 
  • Alerts already linked to another report for the same asset are flagged and rendered unavailable for duplicate selection. 
  • During editing, users can view, add, or unlink alerts without deleting the original event. 

Important: Association is optional, and alerts generated prior to this update are unavailable for retroactive linking. 


3 – Revamped Reports 
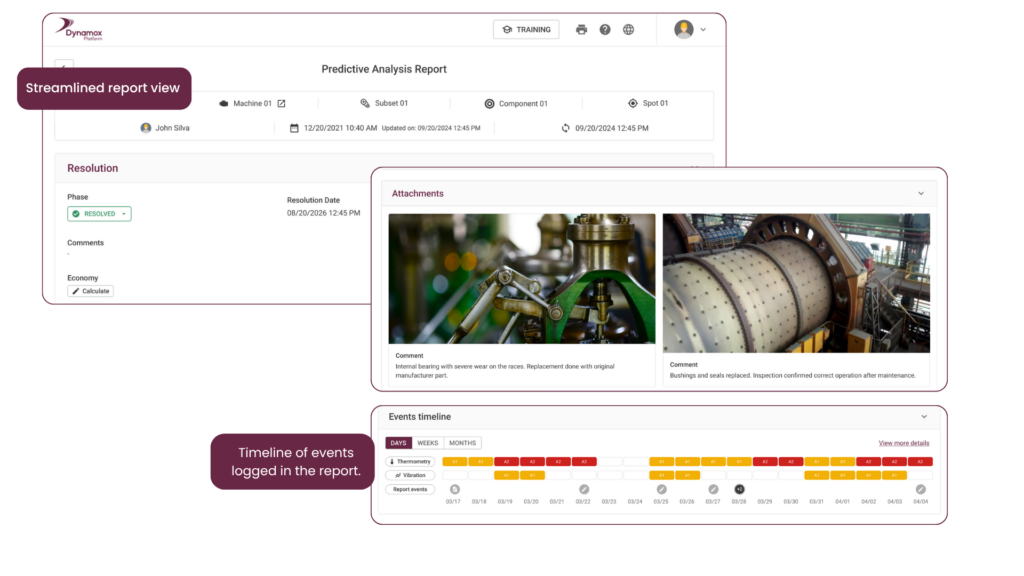
Predictive and sensitive analysis reports now feature a more compact, responsive layout, consolidating the entire context into a single document. 
All previously logged data remains fully intact. 

The Practical Impact 

  • Attachments no longer consume an entire page each, significantly optimizing the generated PDF file size. 
  • A newly added History section automatically logs all relevant actions performed within the report. 
  • Linked alerts now populate their own dedicated section, providing clear documentation of the events that prompted the report. 
  • In the Reports Dashboard, a new monitoring technique column and corresponding filter empower users to quickly locate reports by Vibration or Thermometry. 

4 – Background Mass Asset Configuration 
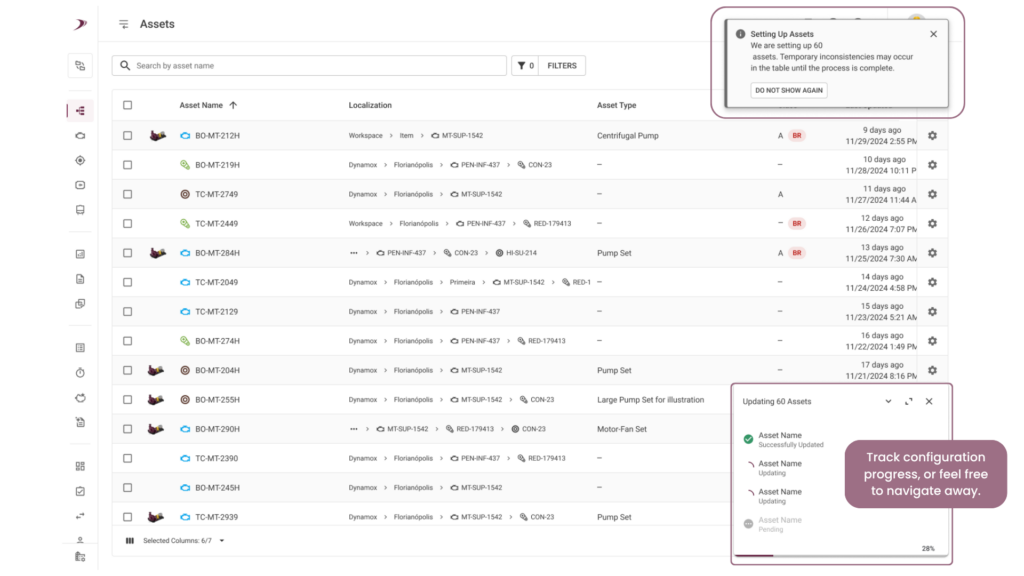
Previously, users were required to stay on the screen until processing concluded, a cumbersome step for large batches. 
The operation now runs entirely in the background. 

The Practical Impact 

  • Users initiate the action and continue navigating the platform, or even close the window, without halting the ongoing processing. 
  • The platform displays execution progress and triggers a notification upon batch completion. 
  • Potential failures receive transparent handling, ensuring greater predictability during tracking. 

 
The result: scaled operational autonomy and maximized productivity for high-volume configurations. 


5 – External System Alarms Visible Inside the Dynamox Platform 
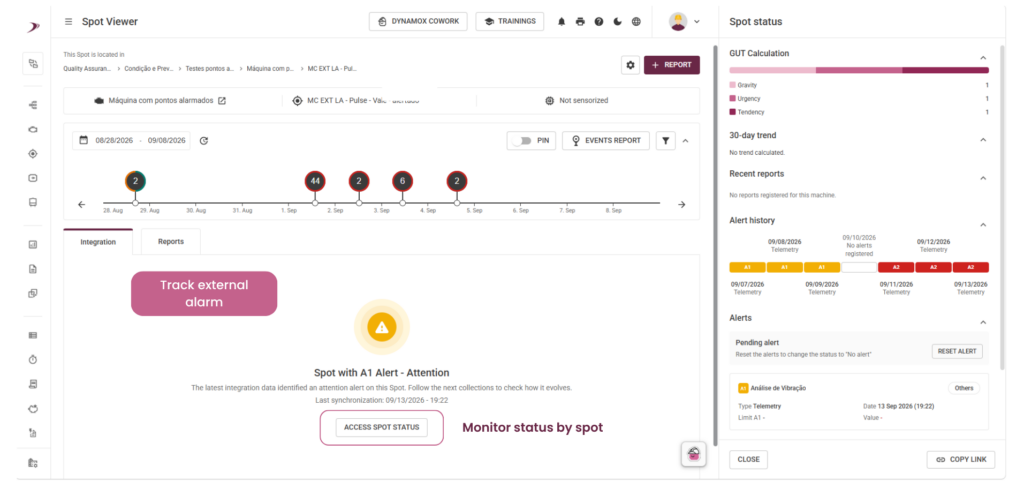
Numerous operations manage alarmed points in legacy or complementary systems, capturing relevant conditions that typically remain outside the platform’s alert workflow. 
The new integration leverages external sources to report the alarm status of monitored points directly to Dynamox. 

The Practical Impact 

  • Users track external alarms seamlessly, eliminating the need to switch between tools. 
  • The platform indicates data sourced from an integration, providing full traceability regarding when and by whom it was updated. 
  • The point displays its received status, such as attention or critical, enhancing the overall assessment of asset health. 
  • Whenever necessary, the reading’s alert status can be redefined directly on the point or within the DMA via the spot situation option. 

Important: Resolving an alert does not automatically shift the A1/A2 status to A0. The action generates a new, updated reading but leaves the prior event status unchanged. This must be considered when interpreting point history.

6 – Your Logo on Dynamox Cowork Reports 
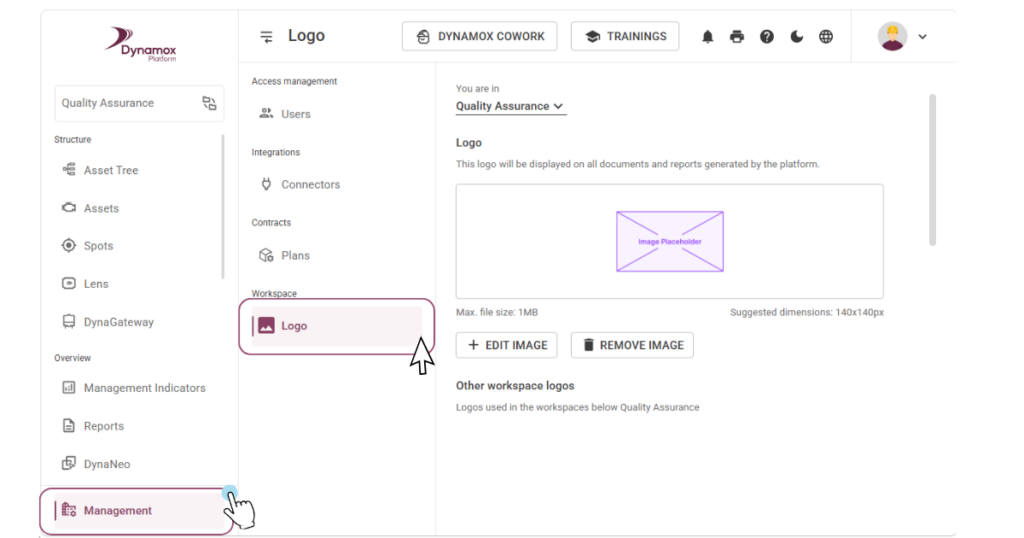
Documents generated by the platform frequently circulate independently or as attachments to client corporate materials. They can now feature your organization’s logo, initially available for Dynamox Cowork reports. 
To configure it, navigate to the Administration menu and select the Logo option in the auxiliary menu. 

The Practical Impact 

  • Users select the target folder for the logo and upload a PNG, JPG, or JPEG image (up to 5 MB). 
  • The same interface displays logos configured in subfolders beneath the selected one, streamlining management across multi-plant operations. 
  • Child folders automatically inherit the parent folder’s logo, though specific configurations consistently take precedence: a child folder with its own designated logo overrides the inherited one. 

Important: This configuration is restricted exclusively to users with Workspace Administrator profiles. 

The interface does not support cropping, zooming, or rotating the image. The file must be prepared in an image editor prior to uploading. 

These improvements were designed to make your monitoring more intuitive and efficient, contributing to a more agile and clear operation in your daily routine. 
Do you have any questions or want to know more details about any of these updates? 
Talk to our team! 

Web: August 2 | 2026

Hello,

Stay up to date with the latest features and enhancements we’ve just launched on the Dynamox Platform.

Check out what’s new and leverage these updates to their fullest! 


Mass Asset Configuration 

Previously, defining type, manufacturer, model, risk class, and business risk required opening one asset at a time. At scale, configuring thousands of assets was unfeasible. 

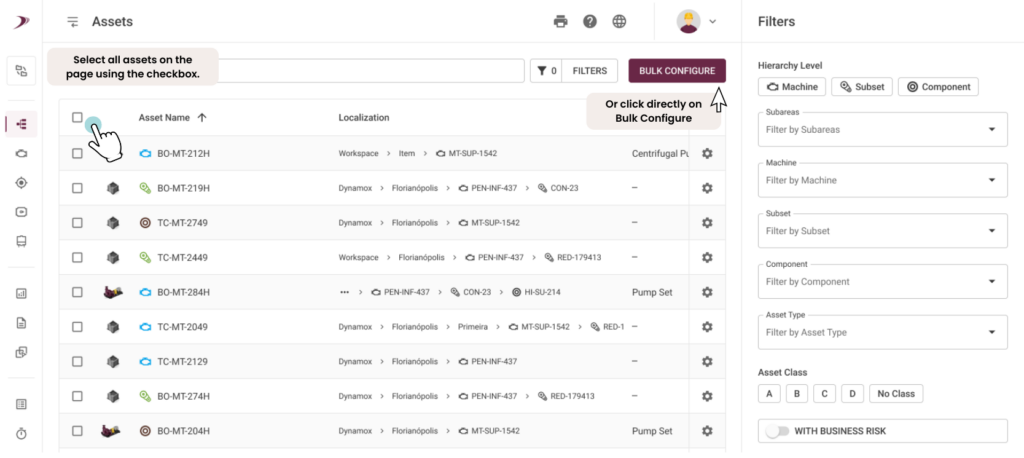
To streamline this, we have released Mass Asset Configuration, now available on the new Assets page. 

Why it matters 

Type and risk classification are not just registration fields. They drive coherent asset prioritization and the reliability of platform insights. Untyped assets participate less in analysis, meaning a configuration gap can quickly become a diagnostic gap. 

What changes in practice 

  • Scale — up to 1,000 assets per operation in a single run. 
  • Standardization — similar assets no longer diverge due to manual entry differences. 
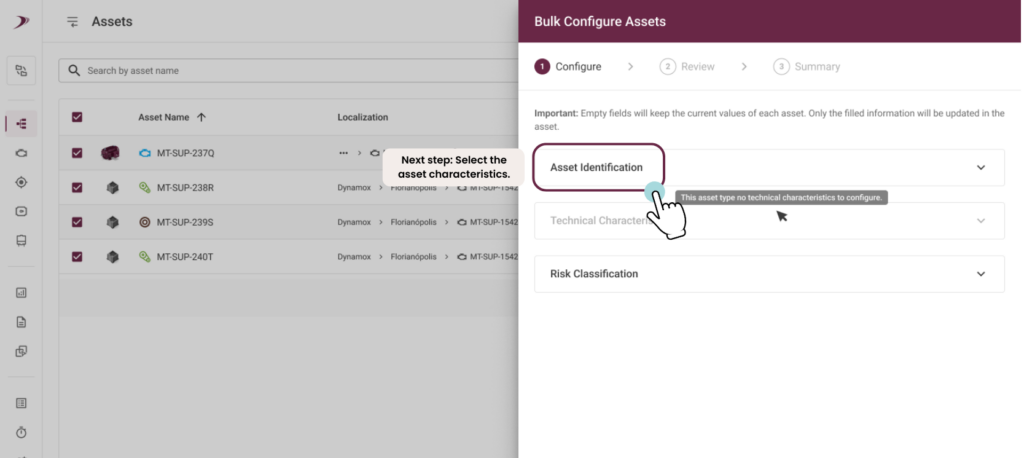
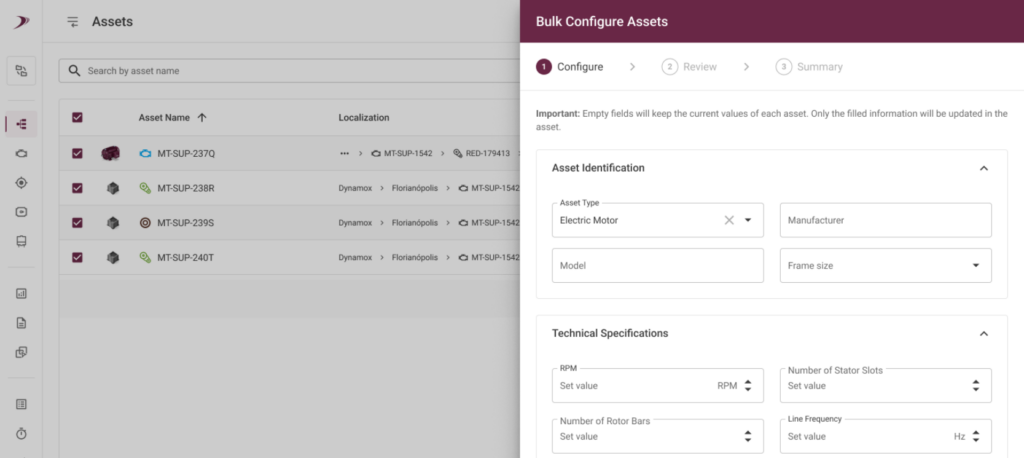
  • Depth — when a type has specific technical characteristics, they are included in the bulk update. Example: Selected an electric motor? Configure the number of rotor bars and stator slots for all of them at once. 
  • Reliability — each asset is processed individually. If one fails, the others proceed, allowing you to retry only the pending ones. 

How to use it 

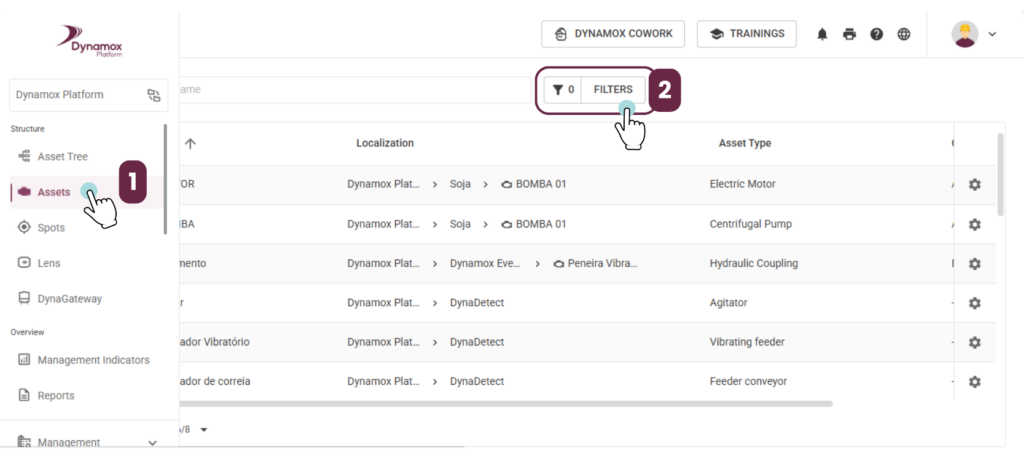
  1. In Assets, filter what you want to configure. Filter by “no type” to spot exact gaps, or search by name.

2. Select the assets or go directly to Mass Configuration (the first 1,000 are automatically selected). 

3.Define the batch data: identification, technical characteristics, and risk classification. 

4.Fill in the details, review the summary, and confirm. 

5. Once saved, you can move on to the next batch. 

Best time-saving practice: group only assets with the same configuration goal. A purpose-driven batch yields better results than a large, mixed one.

Why is this update important? 

In the new Decision Making Assistant (DMA), the GUT matrix prioritizes your assets and pinpoints where maintenance should act first. To leverage this prioritization, assets must be correctly classified with populated criticality, business risk, and other attributes. 

Configuring this data ensures the platform receives the necessary inputs, empowering you to unlock the full potential of GUT prioritization. 

Previously, entering this data meant opening one asset at a time. Now, you can classify dozens of assets in a single batch operation. 

The result: less manual work, a streamlined environment setup, and a consistent foundation for the GUT matrix to deliver more accurate prioritizations. 


PDF Reports and Image Downloads in Thermal Viewer 

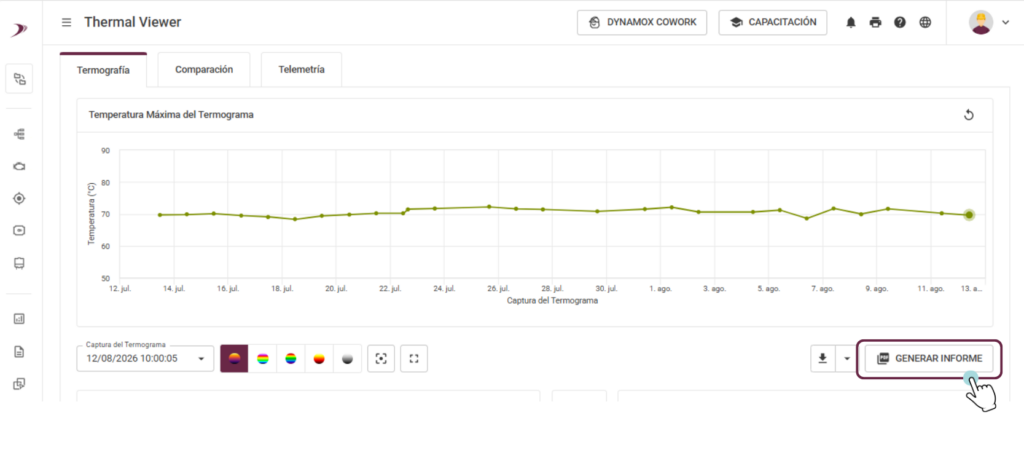
From now on, the Dynamox Lens Thermal Viewer generates a thermography report directly within the platform.

What changed? 

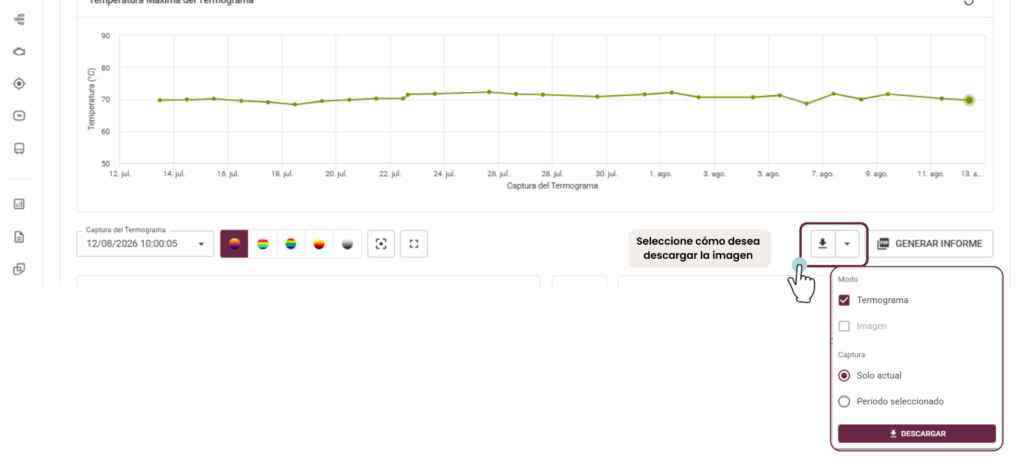
A new report generation button in the Thermal Viewer opens a modal where you can configure exactly what needs to be documented: 

  • Capture period 
  • Thermogram color palette 
  • Regions to include in the analysis 
  • Mode: thermogram, visible light image, or both  
  • Annotations and temperature scale: include or exclude 

Clicking Export automatically generates and downloads the formatted PDF. 

Plus: image downloads 

Beyond the report, you can now download individual thermographic images for presentations, comparisons, or your own report templates.

Selecting “Selected Period” generates a ZIP file with multiple images. Choosing “Thermogram + Image” downloads both images in the same file. 

What does this change in practice? 

Inspection evidence ready to attach to reports, with no layout revision needed 

Less operational time spent on internal reports 

Real monitoring traceability, featuring exportable documents with automatic asset and date identification 

This feature is already live and available in the web flow for any configured Dynamox Lens.


Audio Download in Spectral Viewer 

Download the vibration audio measured by the Spot and track equipment condition over time. 

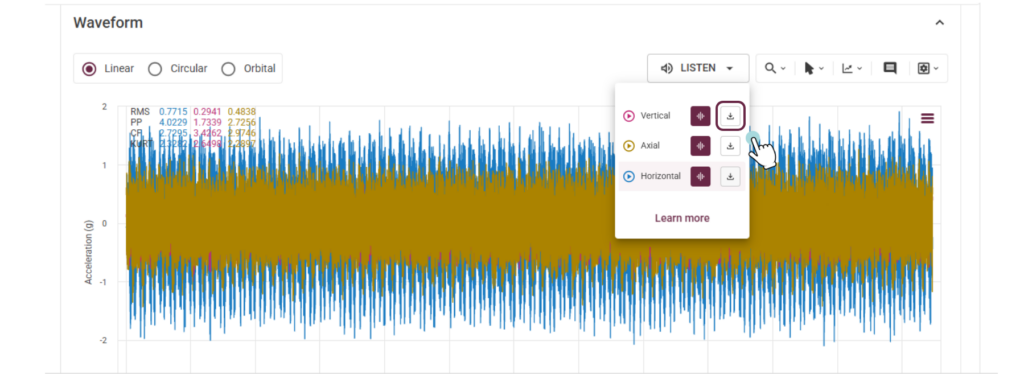
It is now possible to download the audio generated from the vibration measured by the Spot. This transforms what was once a transient on-screen sound into a permanent record, documenting exactly how the equipment behaved when an anomaly was identified. 

Audio is no longer just an impression; it becomes archivable, comparable, and transferable evidence across teams. 

What changes in practice? 

On-the-spot recording. Save the audio from the exact moment a deviation appeared, alongside the spectrum and waveform from that instance. 

Before and after interventions. Download the audio from the same point post-repair and compare. It provides a direct way to demonstrate maintenance results—whether to operations, leadership, or the execution team. 

Beyond the platform. Attach it to technical reports, leverage it in critical analysis meetings and presentations, or share it with another analyst for a second opinion. 

Details 

  • Downloads are generated as separate files for each axis. 
  • Exported in WAV format, compatible with standard media players and audio analysis software. 

This feature is already available in the Spectral Viewer. 


Asset Tree Redesign 

The Asset Tree has been redesigned to make asset registration and editing simpler and more intuitive.

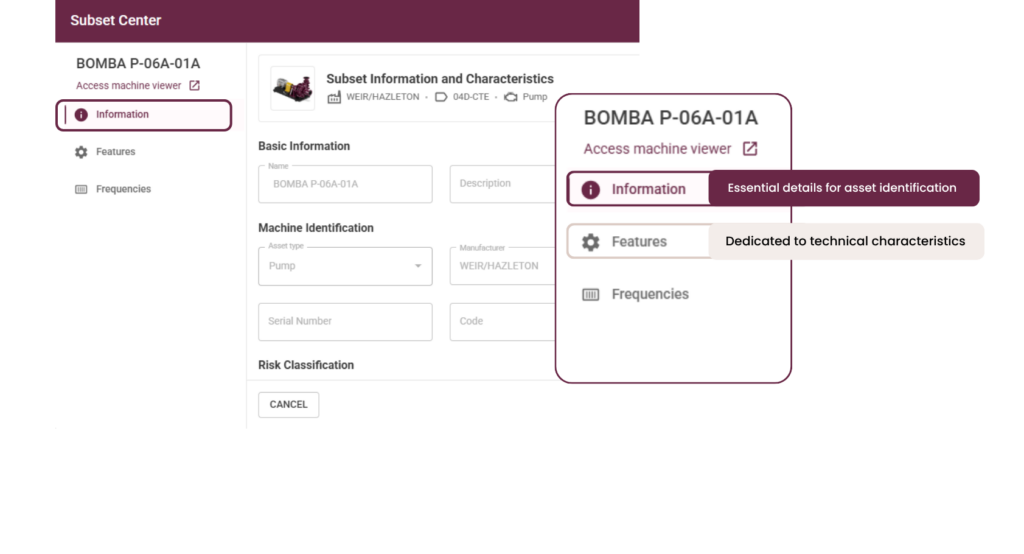
Previously, general and technical information were combined in a single form, making data entry tedious. The process is now divided into two clear steps: 

  1. Information — asset type, risk class, business risk, and other data common to any asset. 
  1. Technical Characteristics — displayed only when the selected asset type has specific technical fields. 

This new structure streamlines the flow. First, you fill in what is common to all assets, then move on to the technical details. 

The result: faster, more consistent, and easier-to-review registrations. 

These improvements were designed to make your monitoring more intuitive and efficient, contributing to a more agile and clear operation in your daily routine. 
Web: July | 2026

Hello,

Stay up to date with the latest features and enhancements we’ve just launched on the Dynamox Platform.

Check out what’s new and leverage these updates to their fullest! 
___________________________________

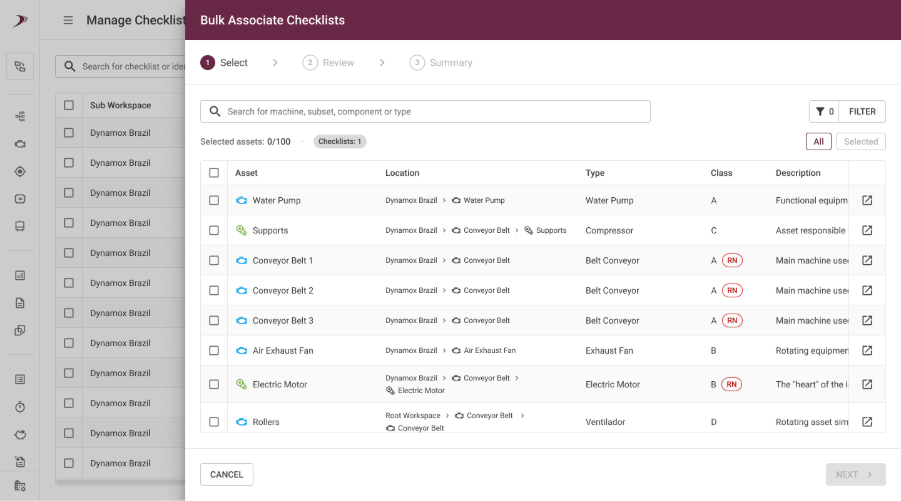
1.Bulk Checklist Association 

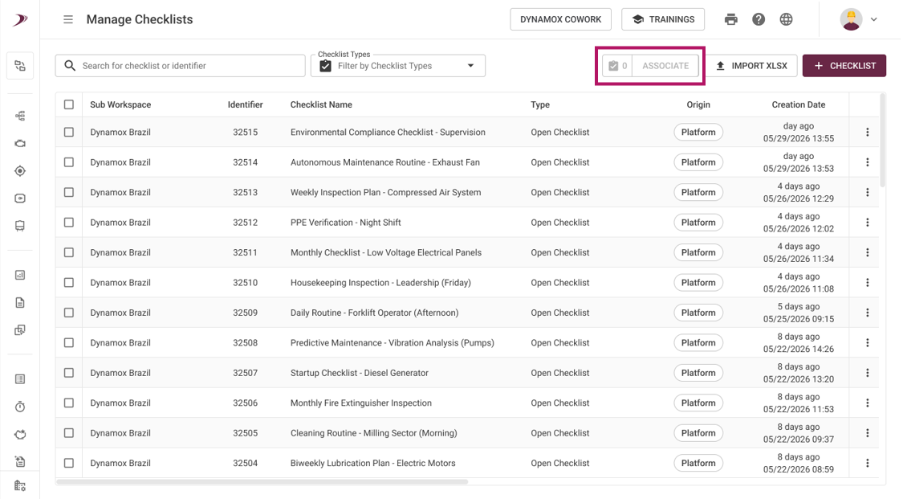
Users can now associate multiple checklists with multiple assets at once, eliminating the need for item-by-item configuration. What once required a manual, time-consuming effort can now be accomplished in just a few steps, directly within the platform, streamlining operations without relying on support tools. 

Associate without breaking the flow: from the Manage Checklists screen, users select the desired checklists via checkboxes and trigger the bulk association right there—keeping the management workflow seamless. The action can also be initiated directly from the toast notification displayed after creating or editing a checklist. 

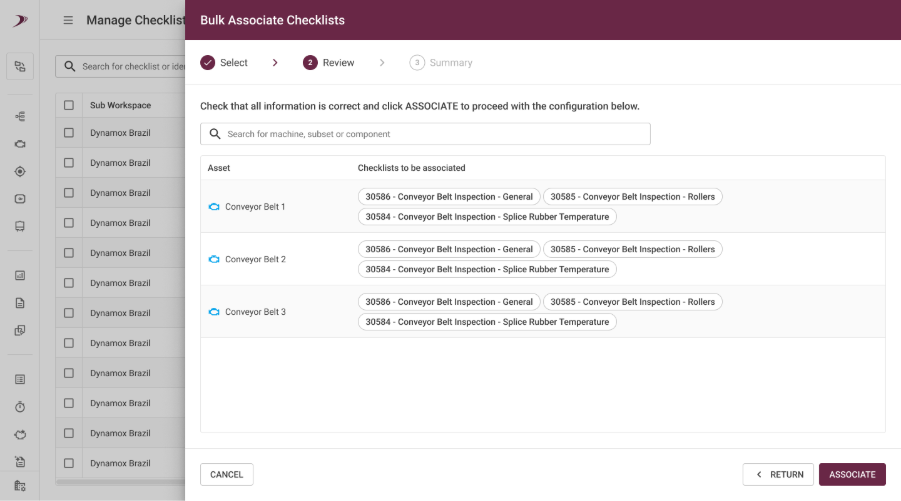
Guided workflow: The association panel drives the user through three clear stages: Select (choosing assets, leveraging filters and search), Review (making adjustments before confirmation), and Summary (a consolidated view of assets, checklists, and locations). This delivers complete visibility over the entire process. 

Flexible asset selection: in the selection stage, users view columns such as Asset, Type, Class, and Description, empowering them to filter or search to pinpoint the exact machines required. 

Final validation: before finalizing, users can review and modify the established associations, proactively reducing setup errors.

The real benefit: Configuring the Asset Tree becomes a centralized and agile process. It empowers users with unparalleled autonomy and control over how they organize their checklists. 

These improvements were designed to make your monitoring workflow more intuitive and efficient, contributing to a faster and clearer operation in your day-to-day activities.  

If you have questions or want more details about any of these updates, talk to our team!   

Until next time! 

Dynamox Team

Web: February | 1/2026

Hello,

Stay up to date with the latest features and enhancements we’ve just launched on the Dynamox Platform.

Check out what’s new and leverage these updates to their fullest!

_____________

ANALYSIS PLAN 

Organization, standardization, and control for analysis routines. 

The new Analysis Plan feature enables the creation of well‑structured plans designed to meet predictive maintenance requirements and maintenance strategy guidelines. 

This brings operational discipline, clarity, and agility, resulting in safer decisions and more consistent outcomes. 

  • Standardized, traceable routines focused on the assets and critical points that truly matter. 
  • Higher technical quality, with complete and mandatory reports that prevent unsupported conclusions. 
  • Greater operational efficiency with clear prioritization of analyses and centralized process management. 
  • Strategic oversight, allowing leadership to monitor compliance and quickly correct deviations. 

Efficiency in analyses 

With greater traceability, prioritization, and predictive process management, analysts can structure condition analysis routines based on: 

  • the asset tree; 
  • relevant subsets; 
  • and the points that genuinely require periodic monitoring. 

Meanwhile, Operations Leadership monitors plan compliance, evaluates deviations, and ensures consistent execution of the maintenance strategy. 

Importance of reports 

Here, the report is always mandatory for each machine/subassembly/spot. 

Only after completing or updating all monitoring points within the report will the machine’s CHECK be available. Reinforcing analysis quality and preventing conclusions without proper technical justification. 

Hands-on! 

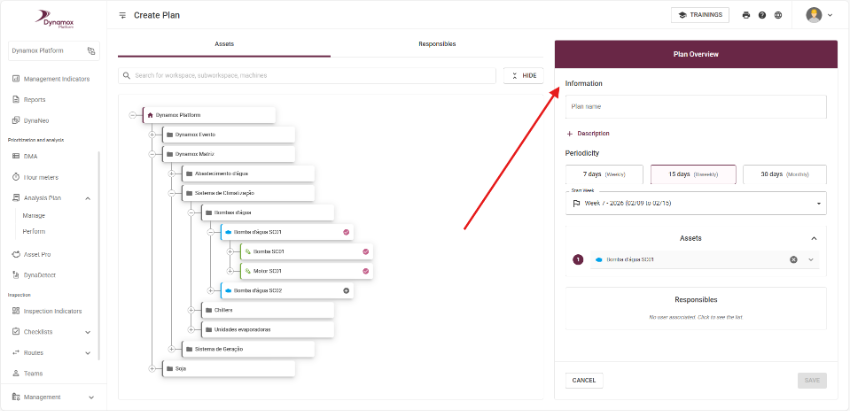
Creating an Analysis Plan 

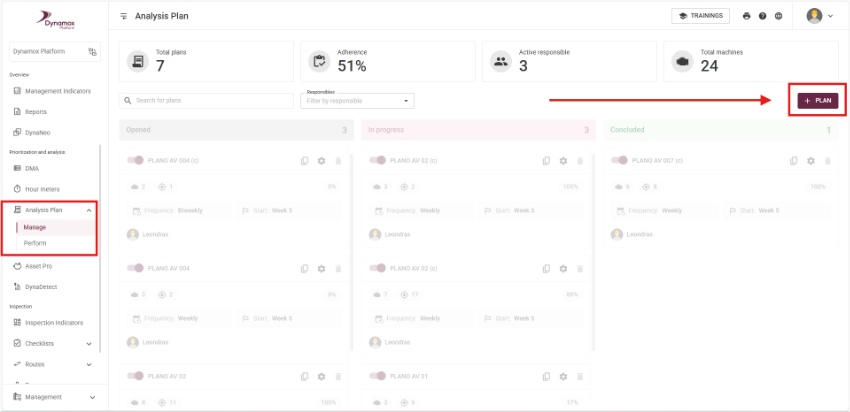
In the Prioritization and Analysis section of the side menu, you’ll find the new Analysis Plan option. 

In Manage, click + PLAN, as shown below: 

Then proceed with the configuration: 

  1. Select the machine to be monitored. 
  1. Choose the relevant sub-items and points for analysis. 
  1. Set the periodicity. 
  1. Assign responsibles. 
  1. Save the plan. 
  1. The analysis plan is now ready for execution. 

The plan will automatically be generated according to the configured periodicity. 

Executing the plan 

When executing an analysis plan, the analyst: 

  • Accesses the machine’s monitoring point for analysis within the same navigation page. 
  • Records the analysis and observations. 
  • Completes the mandatory report. 

Once the report is compliant for all points of the machine, the machine’s CHECK becomes available. 

Managing analysis plans 

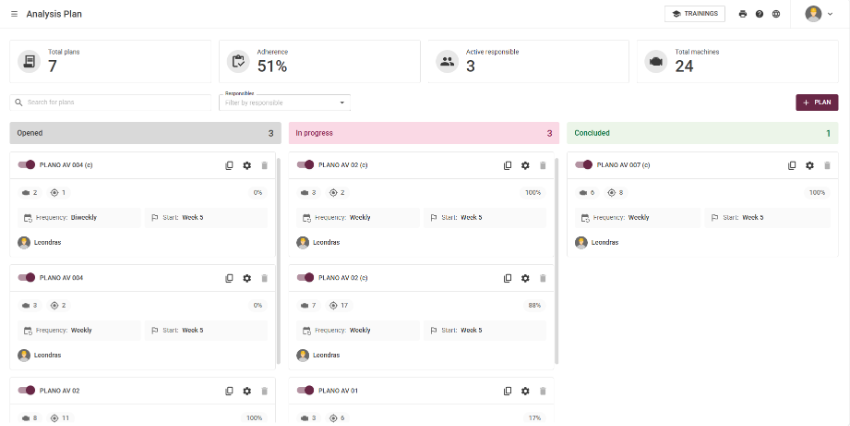
To optimize management, the plan overview provides indicators and a kanban-style display showing the total number of plans, average compliance, responsible analyst, total assets, list of configured plans, and the execution status of each plan. 

This product was designed to make your monitoring experience more intuitive and efficient, helping you streamline daily operations with greater clarity and agility.  

Be an active part of these improvements — the Analysis Plan is currently in the beta stage and open to receive your feedback and suggestions.  

Your insights can shape the next updates.  

Do you have questions or want to learn more about this new feature?  
Get in touch with our team! 

See you next time! 

 
Dynamox Team 

WEB: January/2025

Start the year by exploring the new features of the DynaPredict Web Platform. Don’t miss the chance to optimize your processes with advanced solutions and improvements designed just for you!

🎉 Introducing the Intelligent Standard Spectral Configuration! 🚀

Say goodbye to parameterization issues and step into a new era of efficiency and reliability with our revolutionary feature!!

🔍 What is it?

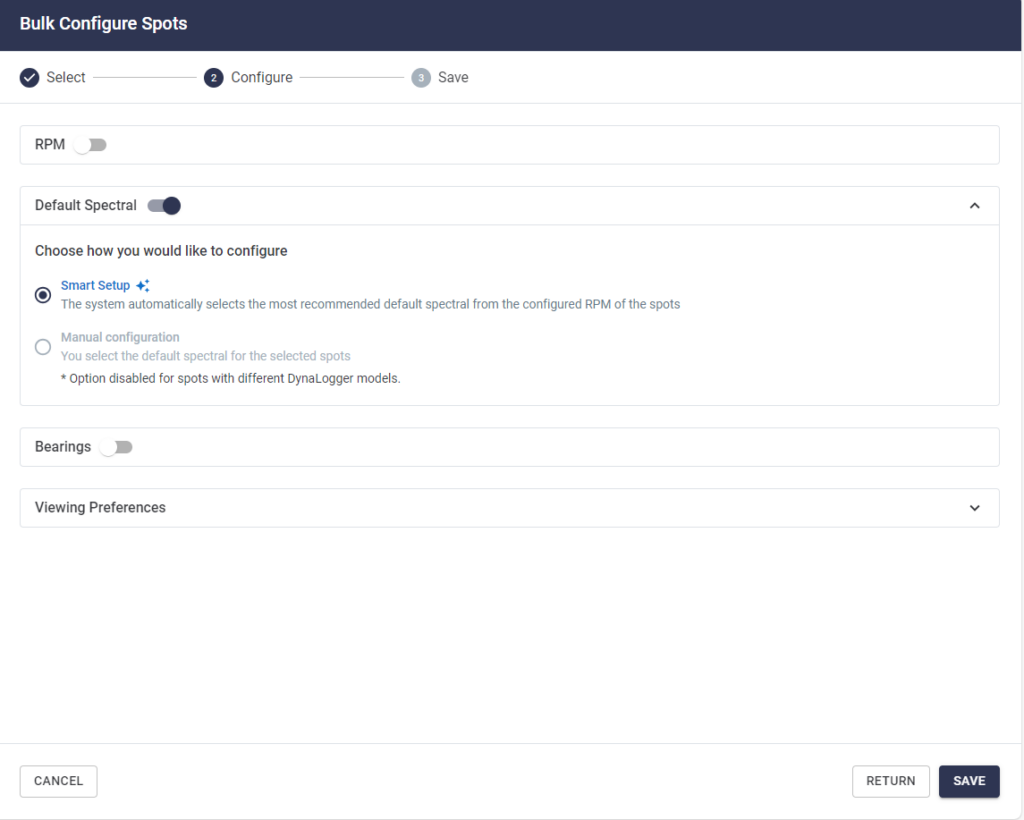
An artificial intelligence designed to automatically configure the Standard Spectral settings of your DynaLoggers based on the RPM and characteristics of the monitored asset.

💡 Why is this important?

Incorrect configurations can compromise fault detection, reduce reliability, and increase maintenance costs. Our solution ensures that your DynaLoggers are always set with the optimal parameters.

✨ Key Benefits:

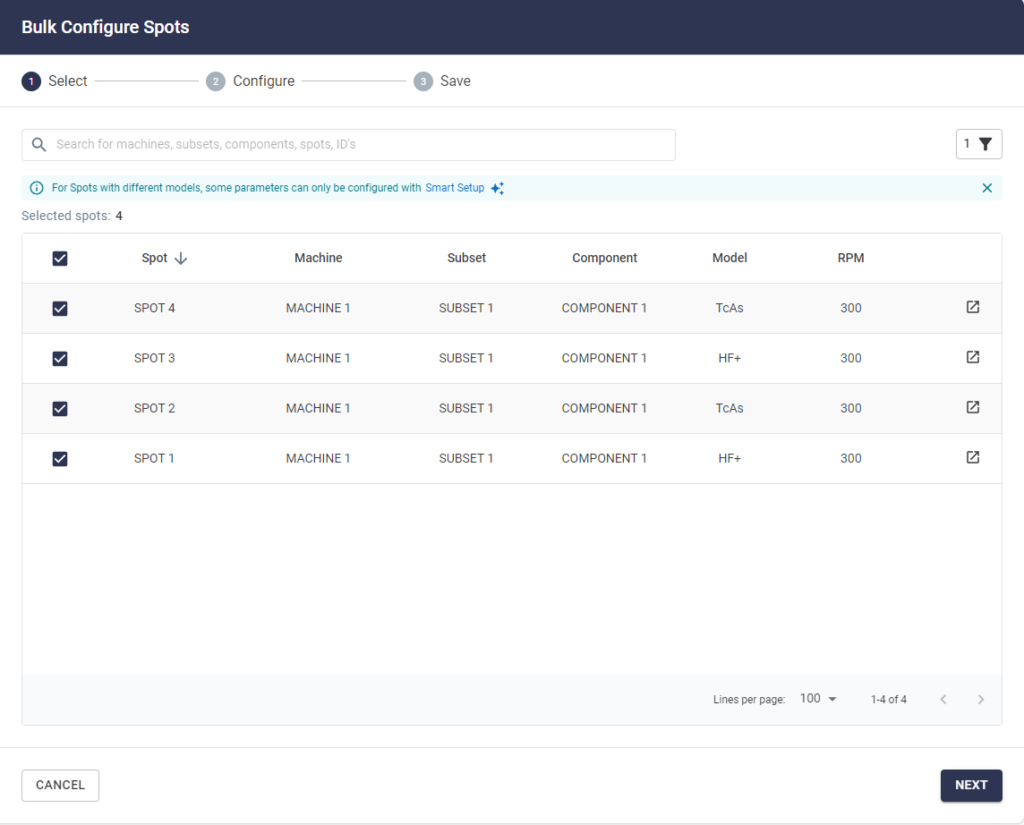
  • Mass Configuration: Adjust dozens or hundreds of Spots with just a few clicks.
  • Optimized Parameters: Guarantee accurate measurements with recommended settings for each application.
  • Focus on Diagnosis: Eliminate failures caused by incorrect configurations and increase the availability of your assets.

⚙️ How does it work?

  1. Select the Spots on the “Mass Spot Configuration” screen, available in “Management Indicators.”
  • Activate Intelligent Configuration and let the tool do all the heavy lifting.
  • Done! Your configurations are optimized, bringing more reliability to your monitoring.

📈 And there’s more:

  • You can still opt for manual configurations when necessary.

Don’t get left behind! Try the Intelligent Standard Spectral Configuration now and reach a new level of monitoring excellence! 💪✨

——————————————————————————————————————————————–

📸 Machine Image and Geolocation: Greater Visibility and Precision in Asset Management 🌍

With the new Machine Image and Geolocation feature of the DynaPredict Platform, asset analysis becomes more intuitive and practical, offering an even more efficient experience. Now, when diagnosing faults or monitoring the performance of your machines, you have a powerful visual and geographic reference to facilitate the identification and differentiation of similar equipment..

✨ Why does this matter?

In plants with identical machines, such as vibrating screens of the same model and manufacturer, it can be challenging to identify which assets have particularities that influence performance. With image and geolocation, each machine gains a unique identity, making analysis easier and your work more accurate.

🔍 How does it work?

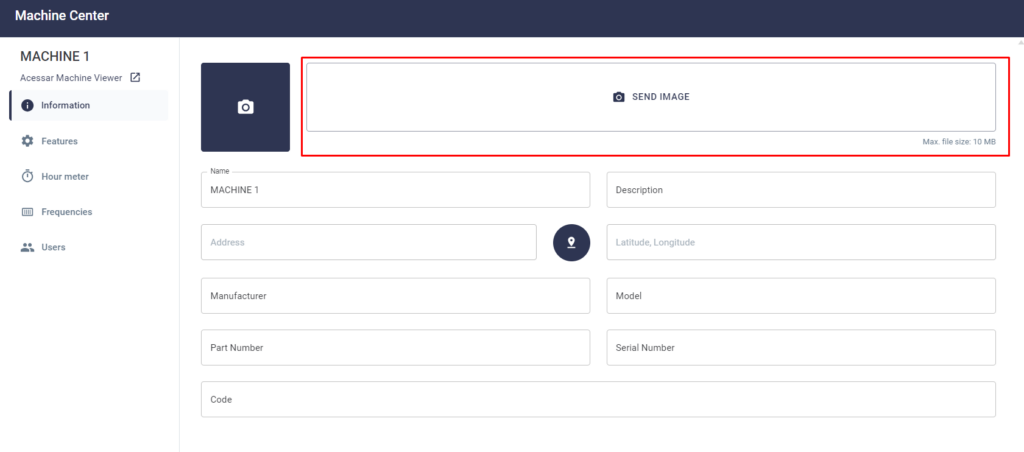
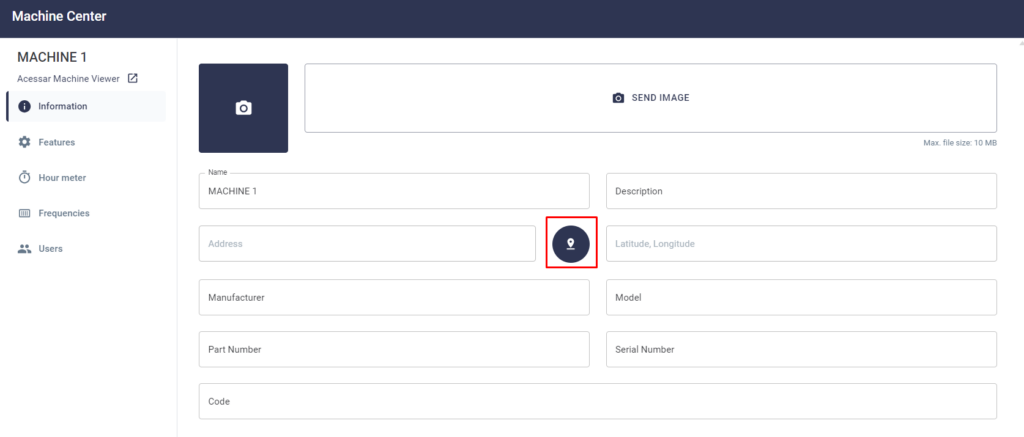
  1. 📷 Add Images: When creating or editing the asset, simply add a photo of the equipment directly in the Machine Center. Visualizing each machine has never been so intuitive.
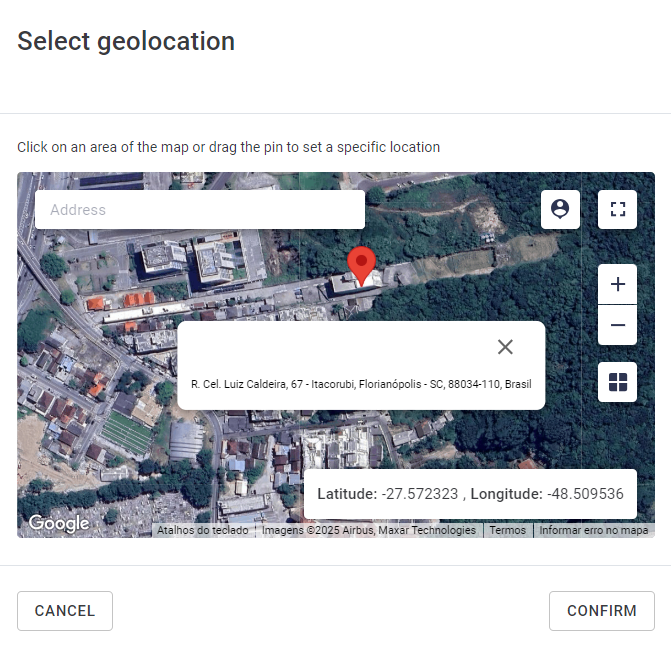
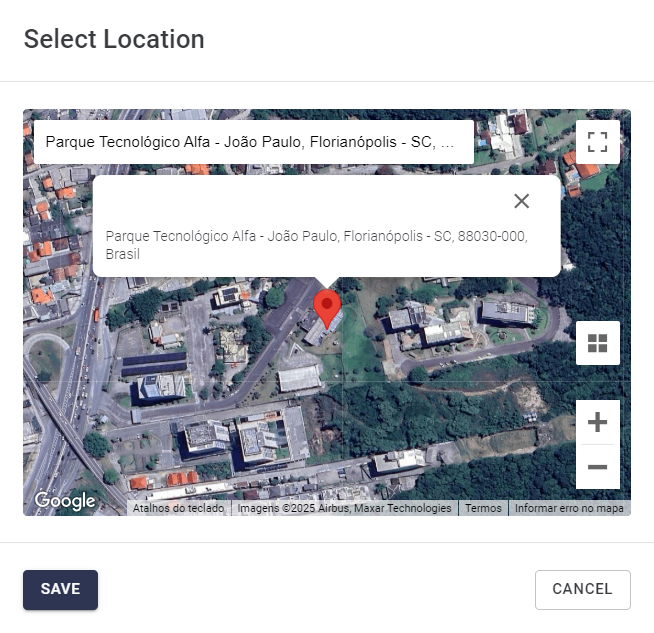
  1. 📍 Set Geolocation: During editing, select the exact location of the machine on the map. This way, you always know where each piece of equipment is, improving management and diagnostics.

🗺️ Where can you see this information?

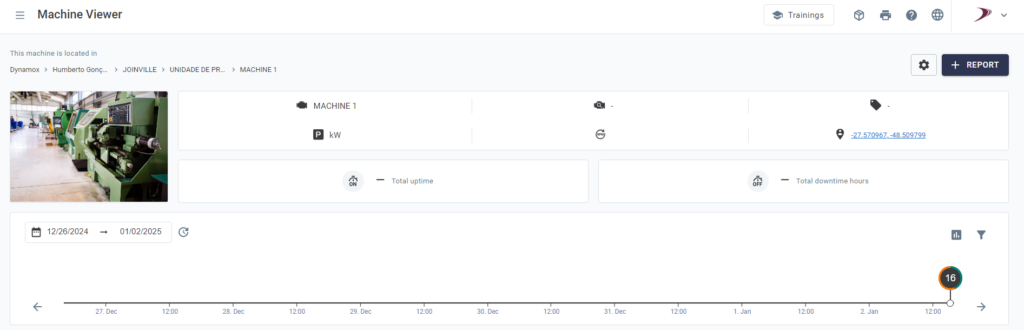
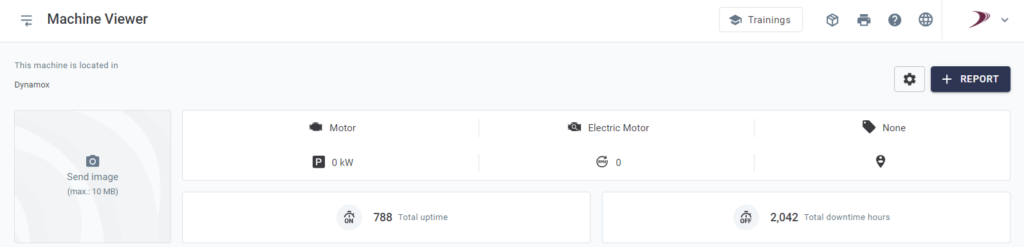
In addition to viewing images and location directly in the Machine Center, all this information is also available in the Machine Viewer. A click on the image expands the view, and clicking on latitude and longitude shows the exact location on the map.

🚀  Simplify, visualize, and manage with precision.

Don’t waste time trying to figure out which machine needs attention. The new Machine Image and Geolocation feature offers more clarity and efficiency for your operations!

——————————————————————————————————————————————–

⚙️ Discover the DynaGateway Center: Organize and Simplify Your Management!

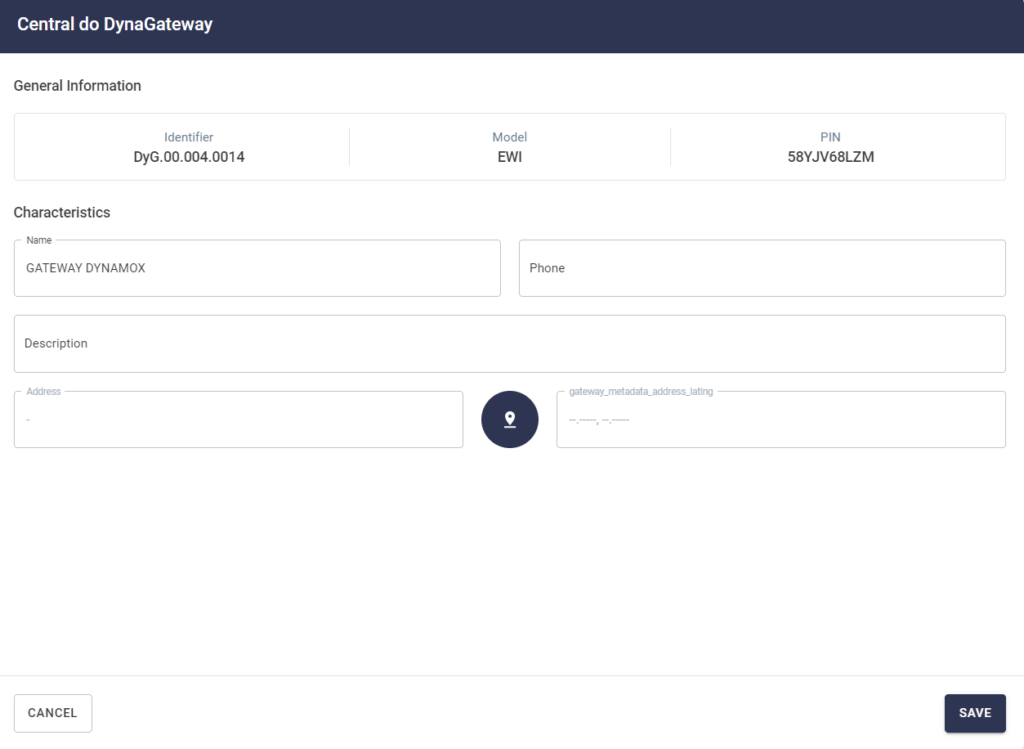
🔧 With the new DynaGateway Center, you can centralize all essential device information. Quickly access it via the gear icon in the top right corner of the page!

📍 In the Center, you can easily store and consult crucial data such as ID, model, PIN, and much more. Customize your DynaGateway by defining the name, associated chip phone number, a brief description, and even the device location. All this with just one click!

📱 And that’s not all! When you apply the settings, all information is saved and available to all users with access. To make it even easier, the device location can be accessed directly through the location icon, ensuring practicality and efficiency.

🌟 Simplify your management and keep everything under control with the DynaGateway Center.

——————————————————————————————————————————————–

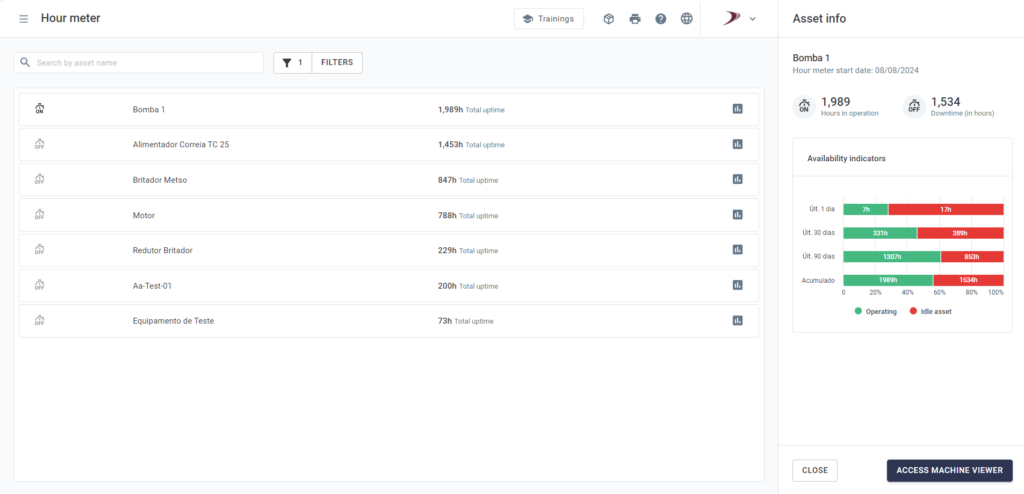
⏱️ Monitor Your Asset Hour meters with Ease!

Tracking the created hour meters has never been so easy and accurate! This new functionality was developed to simplify the visualization of operation and downtime hours of your assets, offering a much more efficient and practical maintenance management routine.
✨ Why is this amazing?

Now you have two simple and effective ways to monitor the recorded hours:
1️⃣ Machine Viewer:

  • View the total operation and downtime hours in an intuitive format (Hours:Minutes).
  • Discover when the hourmeter was created or reset by hovering over the hour icon.

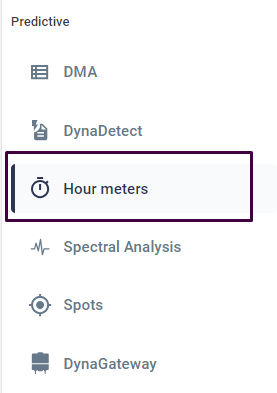
2️⃣ Hour meter Menu (located in the platform’s side menu)

  • Quickly find your assets with advanced search and filters, including by class, business risk, and hours in operation.
  • Access detailed information such as machine status (active or idle), accumulated hours, and charts consolidating data over custom periods (1 day, 30 days, 90 days, and cumulative).

💡 Soon, the hour meter will be directly available in DynaNeo, offering even more convenience and integration. Stay tuned!

Don’t waste time and try this new feature that will revolutionize how you monitor your assets. 🛠️

——————————————————————————————————————————————–

🌟 Make User Management Even More Practical and Efficient!

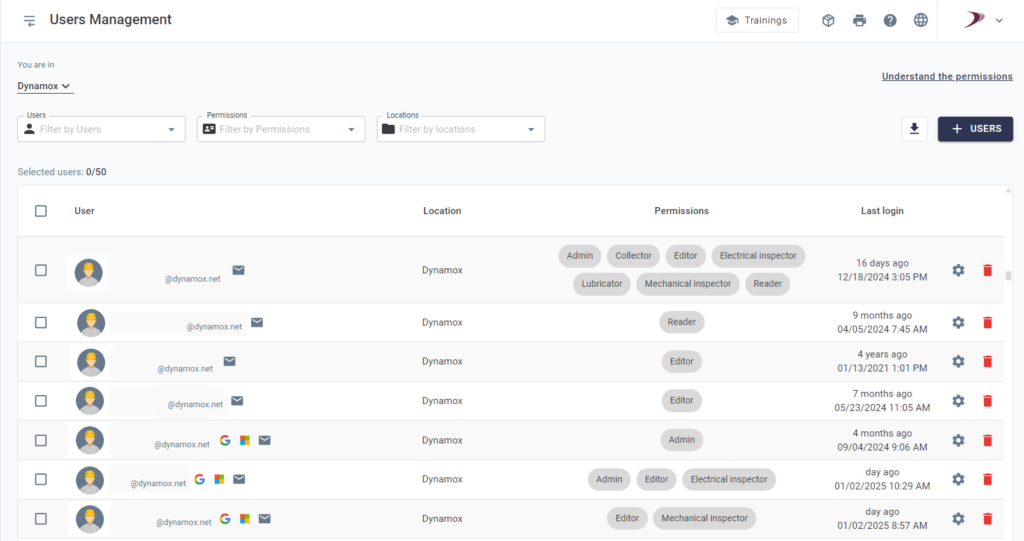
Simplify adding new users to your plant and manage permissions quickly and accurately with the new User and Permission Management interface.
✅ Modern and Intuitive Interface:

  • Centralized navigation makes your experience more fluid and straightforward.
✅ Full Control for Administrators:

  • View the user list, their locations, and assigned permissions.
  • Grant or edit permissions and invite new members with just a few clicks.
  • Remove access as needed.

✅ Personalized Experience for Other Users: View only your permissions and locations clearly and objectively.

🖱️ How to access?

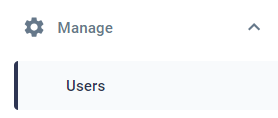
In the side menu, click “Manage > Users” and explore all the new features!

👉 Try it now and discover how user and permission management can be simple, agile, and efficient!

——————————————————————————————————————————————–

🎓 Discover the Training Platform!

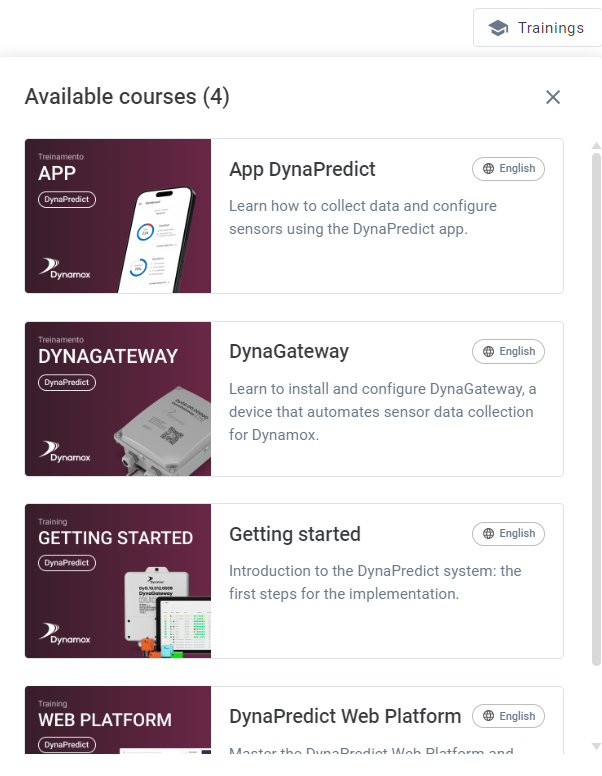
Keeping up with all the training on the DynaPredict Platform has never been easier! With the Training Platform, you have simplified access to all available courses, directly from the platform menu.

💻 The new “Trainings” button in the header allows you to quickly and intuitively view the list of available training in your language.

✨ With a single click, a dropdown list will appear, showing all available training. Best of all: each link takes you directly to the desired training page!

  • 🎯 Quick and Hassle-Free Registration: Registration confirmation is quickly handled by the Dynamox team, ensuring training sessions happen without delays.

🌟 With the Training Platform, Dynamox provides a smooth and obstacle-free learning experience. Don’t waste time and take the opportunity to learn about our solutions in a simple and straightforward way!

——————————————————————————————————————————————–

👉 New Feature in Asset Risk Classification!

It’s now even easier to identify and prioritize critical assets for your business success! With the Asset Risk Classification feature, your operation gains more efficiency and safety, aligning with best asset management practices, such as ISO 31000 and ISO 55000 standards.

✨ Why is this feature essential for you?

  • Clear Differentiation: Quickly identify if an asset poses a Business Risk or has a Criticality Class (A, B, C, or D).
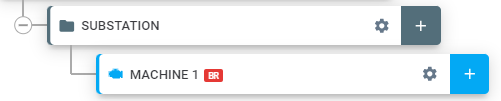
  • Strategic Visibility: Assets classified as Business Risk are highlighted with the “BR” tag, facilitating prioritization and monitoring.

🔧 Simple and Practical Configuration:

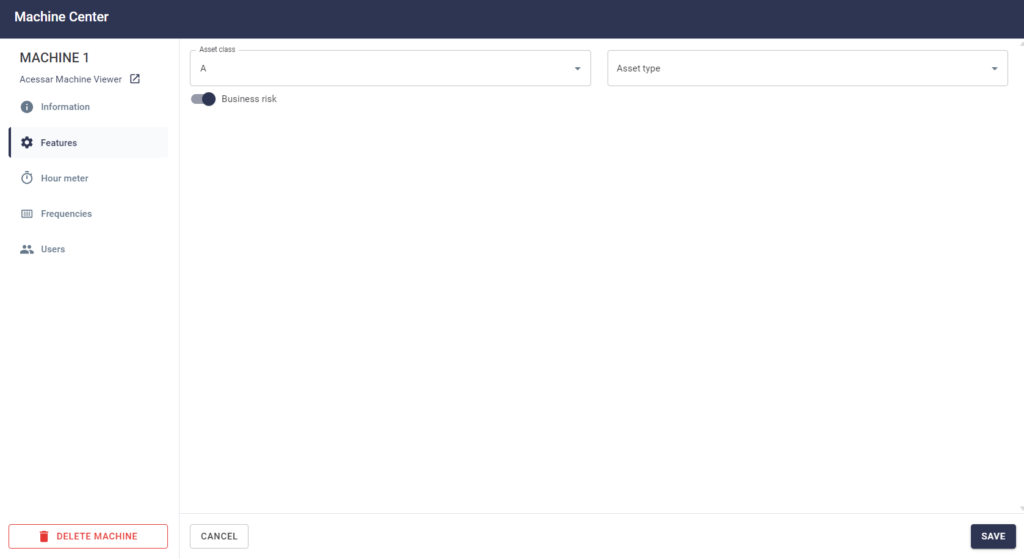
  • When registering or editing assets, enable the Business Risk field in the “Characteristics” tab.
  • Choose the Criticality Class in the corresponding menu.

💡 Transform Data into Decisions:

By combining the ABC Classification methodology with Business Risk identification, the DynaPredict Platform allows you to prioritize resources and attention exactly where they are most needed, ensuring operational continuity and reducing losses.

This is the evolution of asset management you need for 2025! 🚀
Try it now and take your maintenance and reliability strategy to the next level.