iOS – Version 3.22

🚀 Introducing the New Feature: Multi-User Route! 🌟

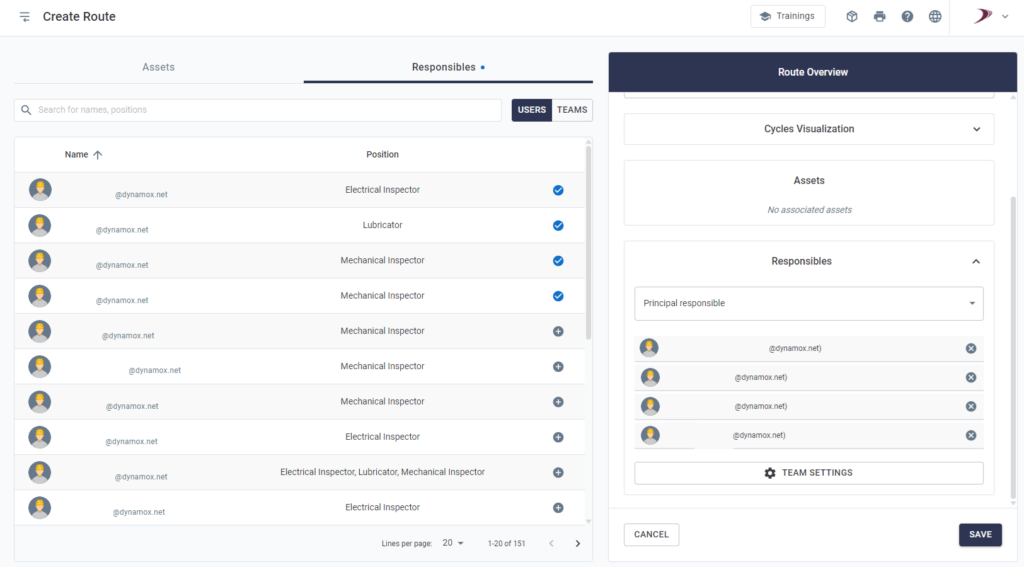
With Multi-User Route, you gain total control and unmatched agility. Now you can:

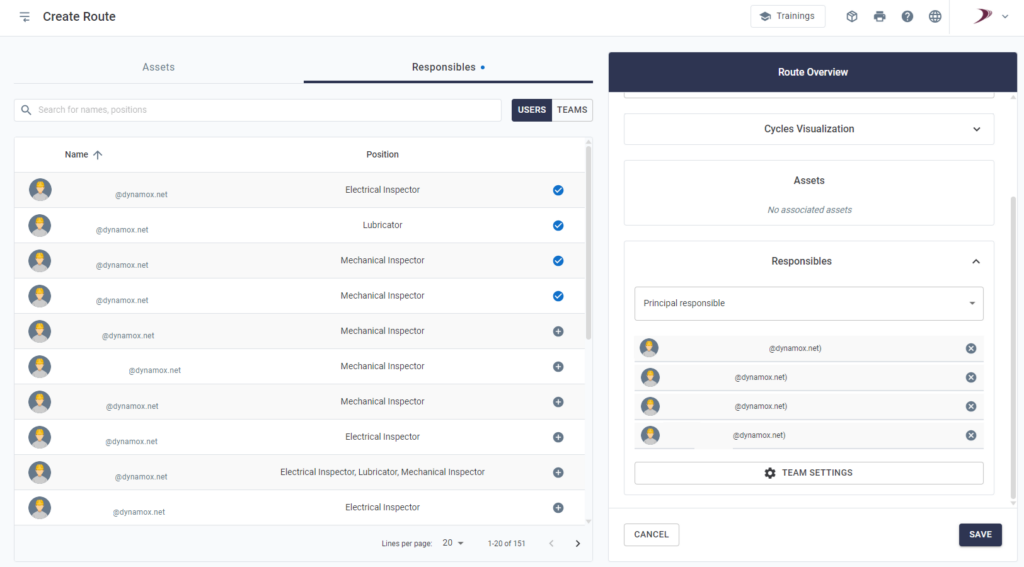
✅ Assign up to 35 individuals to each route or associate it with a team.

✅ Define a Primary Responsible User, who will be assessed in adherence calculations.

✅ Configure reusable teams, optimizing route maintenance and saving time.

How does it work in practice?

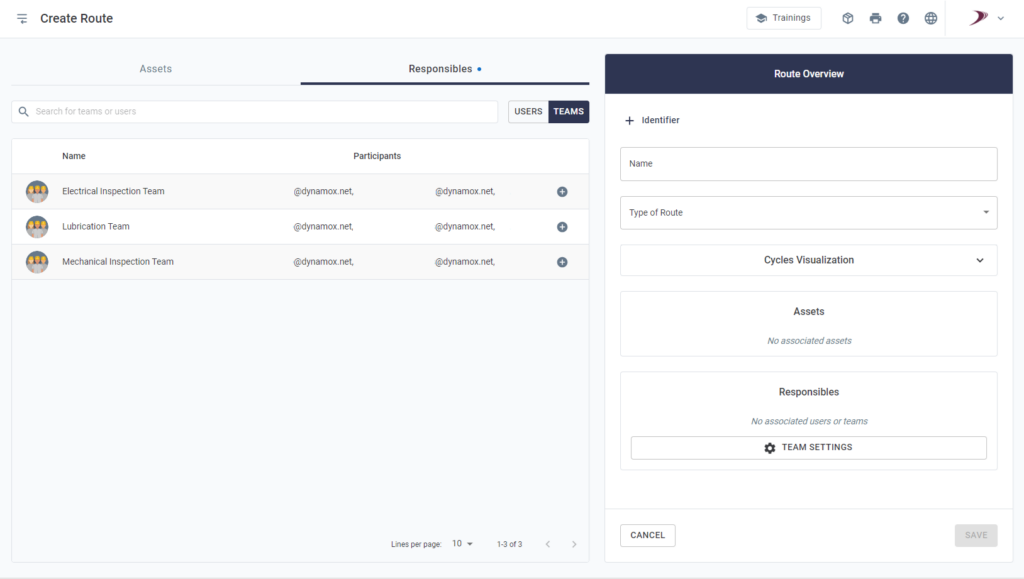
  • Web Platform: Planners create routes and assign users or teams with just a few clicks.
  • Mobile App: Executors take over routes directly from the app with full flexibility, even in offline mode.

📊 Smart Reports: The system differentiates between the user who completes the checklist and the Primary Responsible User, ensuring clarity and traceability.

💡 Benefits at your fingertips:

  • Reduced rework for planners.
  • Increased collaboration among teams.
  • Greater efficiency in route management.

🌟 Transform your inspection process with enhanced flexibility and efficiency!

Android – Version 4.35

🚀 Introducing the New Feature: Multi-User Route! 🌟

With Multi-User Route, you gain total control and unmatched agility. Now you can:

✅ Assign up to 35 individuals to each route or associate it with a team.

✅ Define a Primary Responsible User, who will be assessed in adherence calculations.

✅ Configure reusable teams, optimizing route maintenance and saving time.

How does it work in practice?

  • Web Platform: Planners create routes and assign users or teams with just a few clicks.
  • Mobile App: Executors take over routes directly from the app with full flexibility, even in offline mode.

📊 Smart Reports: The system differentiates between the user who completes the checklist and the Primary Responsible User, ensuring clarity and traceability.

💡 Benefits at your fingertips:

  • Reduced rework for planners.
  • Increased collaboration among teams.
  • Greater efficiency in route management.

🌟 Transform your inspection process with enhanced flexibility and efficiency!

WEB: January/2025

Start the year by exploring the new features of the DynaPredict Web Platform. Don’t miss the chance to optimize your processes with advanced solutions and improvements designed just for you!

🎉 Introducing the Intelligent Standard Spectral Configuration! 🚀

Say goodbye to parameterization issues and step into a new era of efficiency and reliability with our revolutionary feature!!

🔍 What is it?

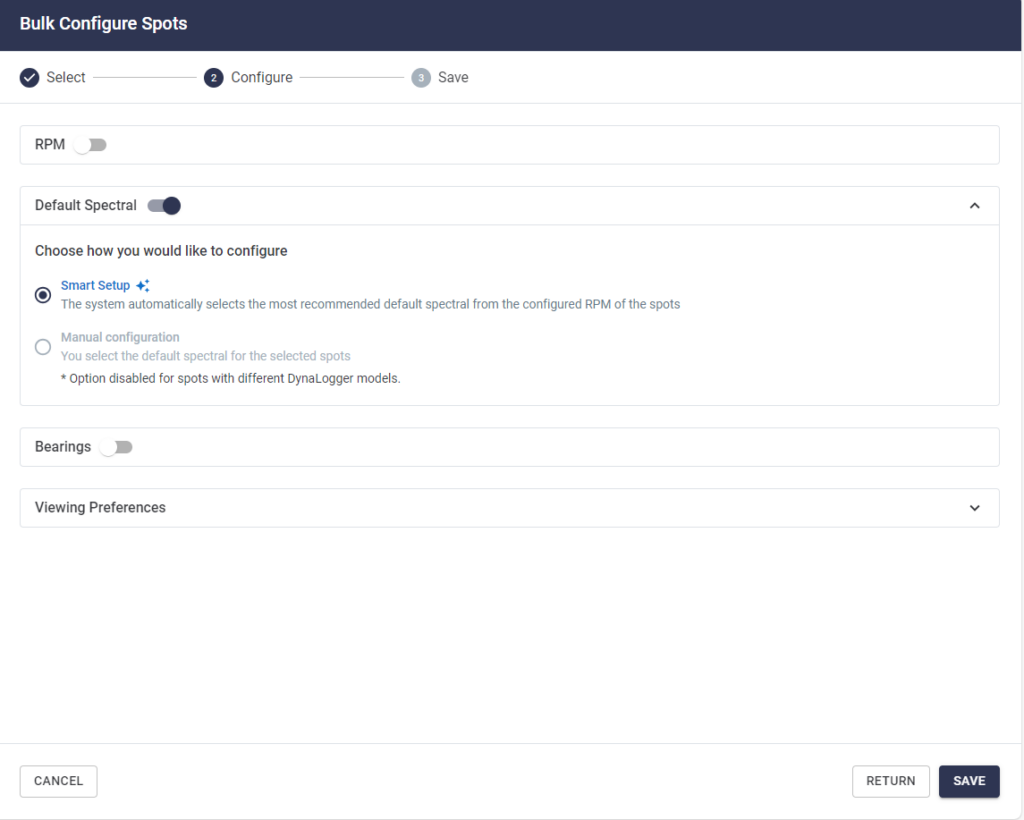
An artificial intelligence designed to automatically configure the Standard Spectral settings of your DynaLoggers based on the RPM and characteristics of the monitored asset.

💡 Why is this important?

Incorrect configurations can compromise fault detection, reduce reliability, and increase maintenance costs. Our solution ensures that your DynaLoggers are always set with the optimal parameters.

Key Benefits:

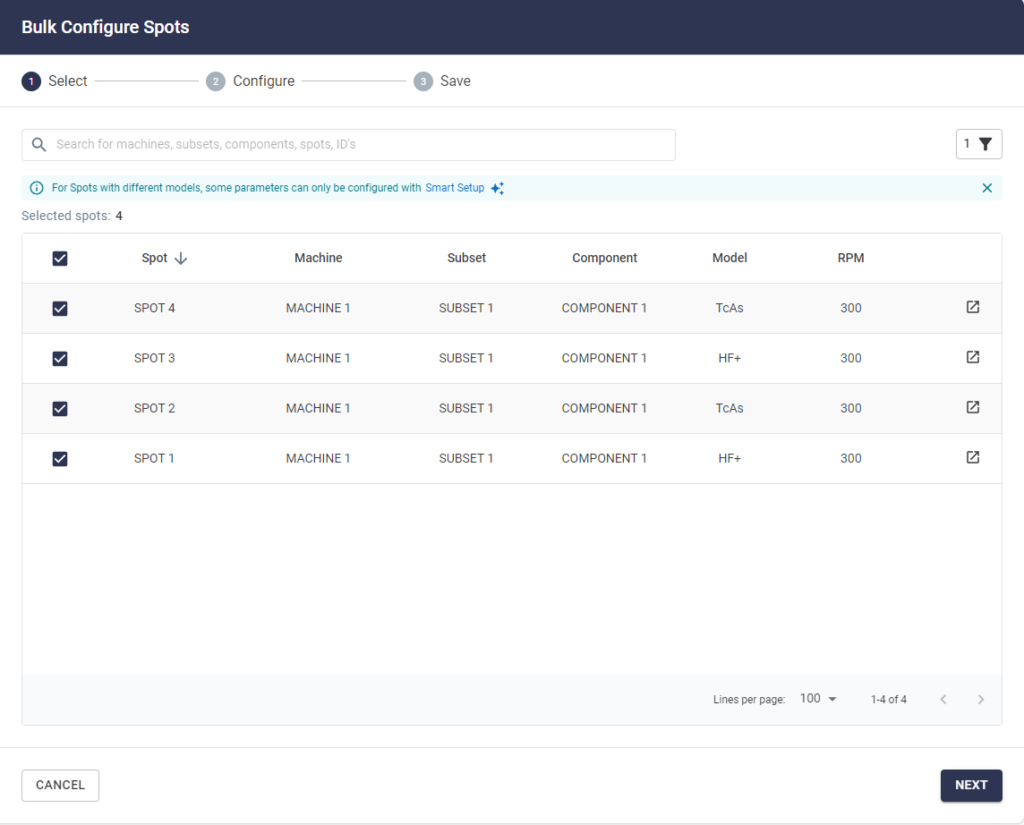
  • Mass Configuration: Adjust dozens or hundreds of Spots with just a few clicks.
  • Optimized Parameters: Guarantee accurate measurements with recommended settings for each application.
  • Focus on Diagnosis: Eliminate failures caused by incorrect configurations and increase the availability of your assets.

⚙️ How does it work?

  1. Select the Spots on the “Mass Spot Configuration” screen, available in “Management Indicators.”
  • Activate Intelligent Configuration and let the tool do all the heavy lifting.
  • Done! Your configurations are optimized, bringing more reliability to your monitoring.

📈 And there’s more:

  • You can still opt for manual configurations when necessary.

Don’t get left behind! Try the Intelligent Standard Spectral Configuration now and reach a new level of monitoring excellence! 💪✨

——————————————————————————————————————————————–

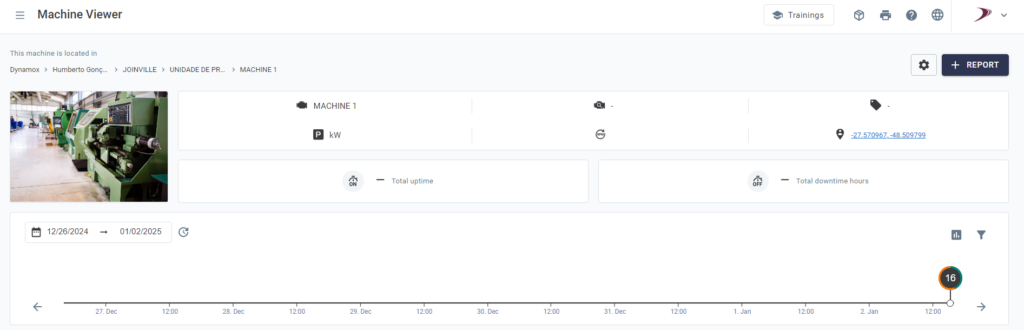
📸 Machine Image and Geolocation: Greater Visibility and Precision in Asset Management 🌍

With the new Machine Image and Geolocation feature of the DynaPredict Platform, asset analysis becomes more intuitive and practical, offering an even more efficient experience. Now, when diagnosing faults or monitoring the performance of your machines, you have a powerful visual and geographic reference to facilitate the identification and differentiation of similar equipment..

Why does this matter?

In plants with identical machines, such as vibrating screens of the same model and manufacturer, it can be challenging to identify which assets have particularities that influence performance. With image and geolocation, each machine gains a unique identity, making analysis easier and your work more accurate.

🔍 How does it work?

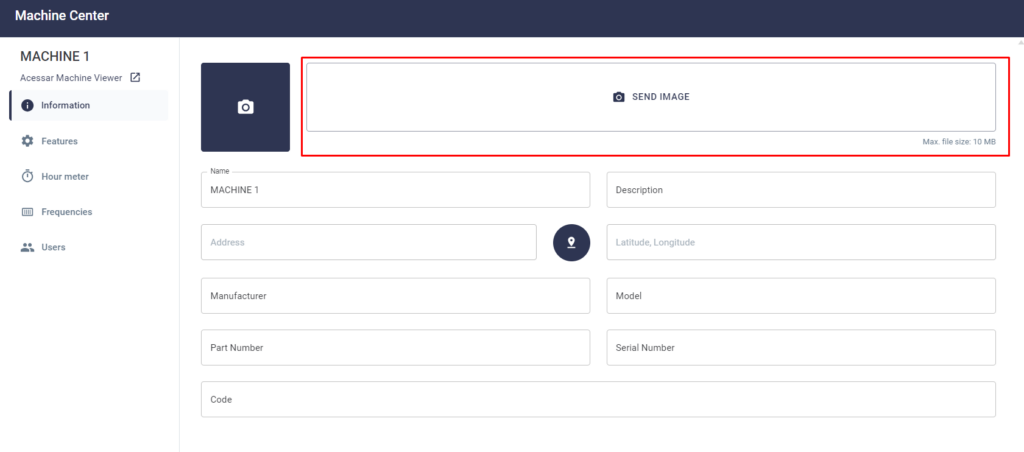
  1. 📷 Add Images: When creating or editing the asset, simply add a photo of the equipment directly in the Machine Center. Visualizing each machine has never been so intuitive.
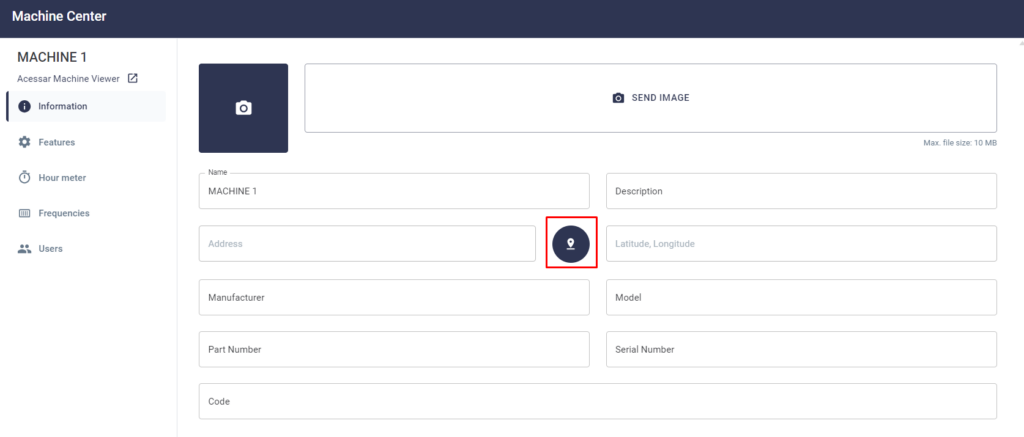
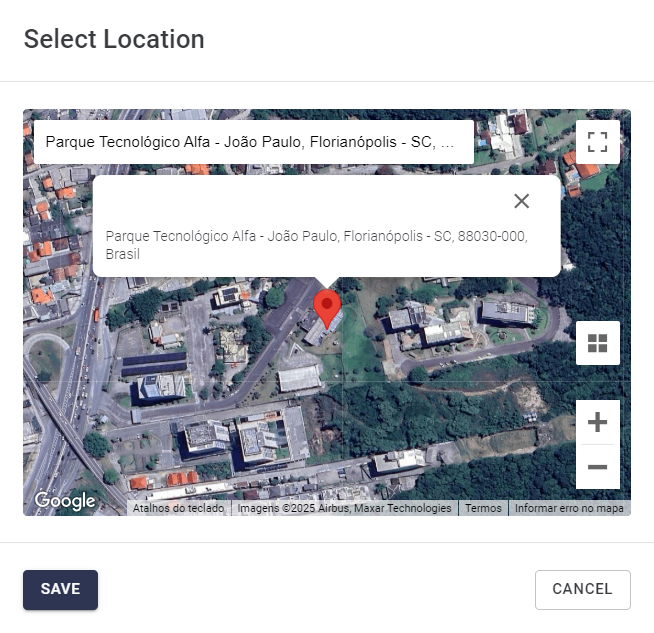
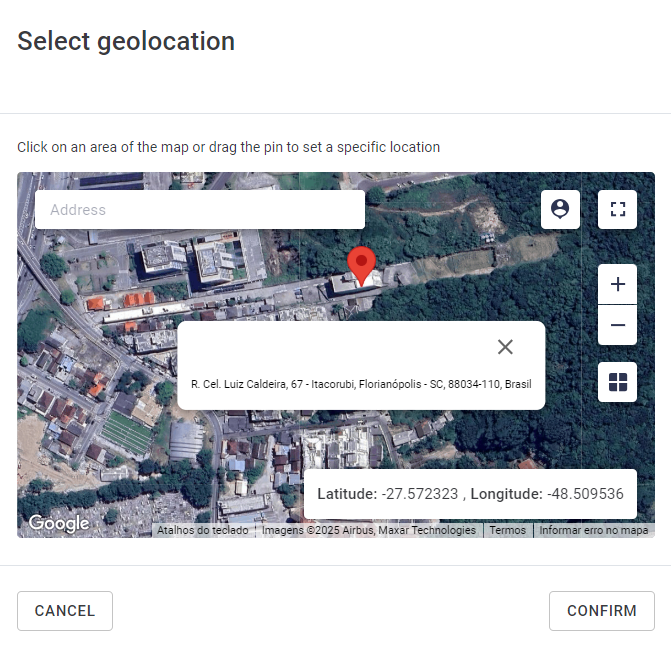
  1. 📍 Set Geolocation: During editing, select the exact location of the machine on the map. This way, you always know where each piece of equipment is, improving management and diagnostics.

🗺️ Where can you see this information?

In addition to viewing images and location directly in the Machine Center, all this information is also available in the Machine Viewer. A click on the image expands the view, and clicking on latitude and longitude shows the exact location on the map.

🚀  Simplify, visualize, and manage with precision.

Don’t waste time trying to figure out which machine needs attention. The new Machine Image and Geolocation feature offers more clarity and efficiency for your operations!

——————————————————————————————————————————————–

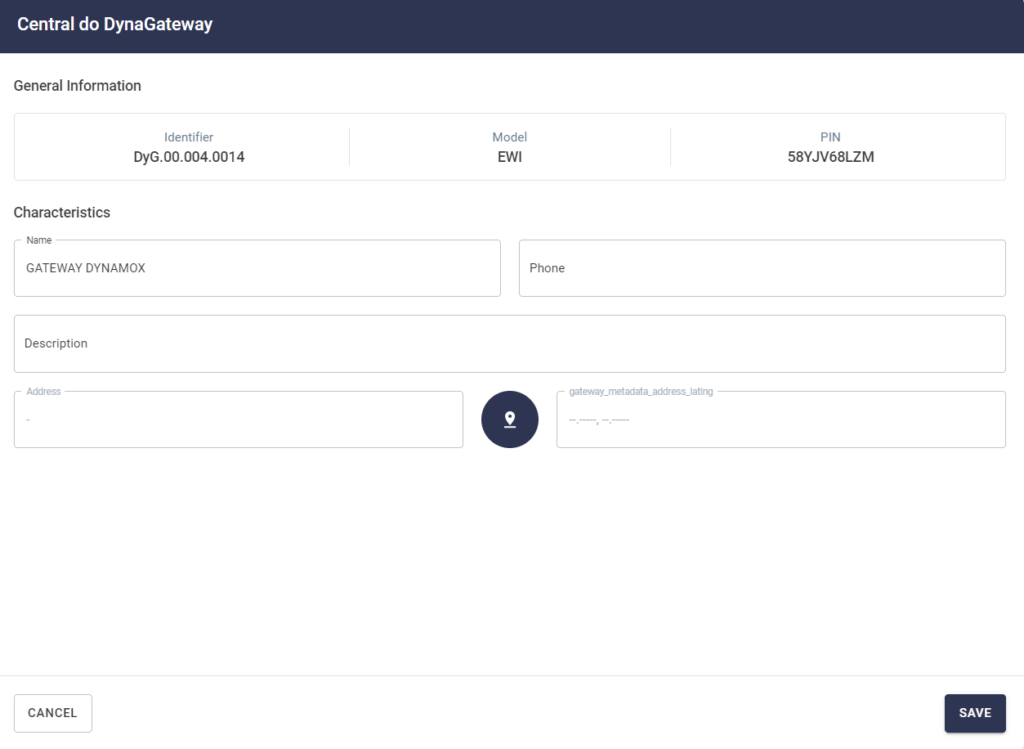
⚙️ Discover the DynaGateway Center: Organize and Simplify Your Management!

🔧 With the new DynaGateway Center, you can centralize all essential device information. Quickly access it via the gear icon in the top right corner of the page!

📍 In the Center, you can easily store and consult crucial data such as ID, model, PIN, and much more. Customize your DynaGateway by defining the name, associated chip phone number, a brief description, and even the device location. All this with just one click!

📱 And that’s not all! When you apply the settings, all information is saved and available to all users with access. To make it even easier, the device location can be accessed directly through the location icon, ensuring practicality and efficiency.

🌟 Simplify your management and keep everything under control with the DynaGateway Center.

——————————————————————————————————————————————–

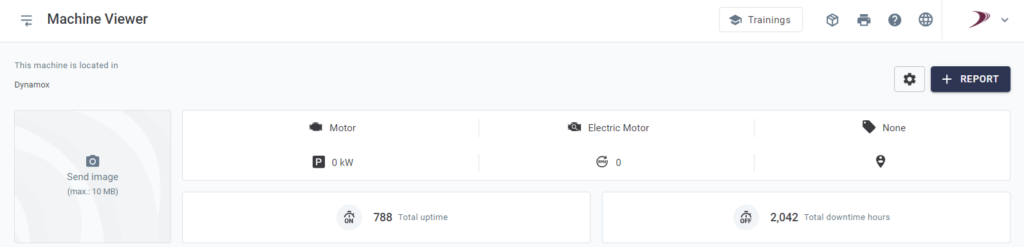
⏱️ Monitor Your Asset Hour meters with Ease!

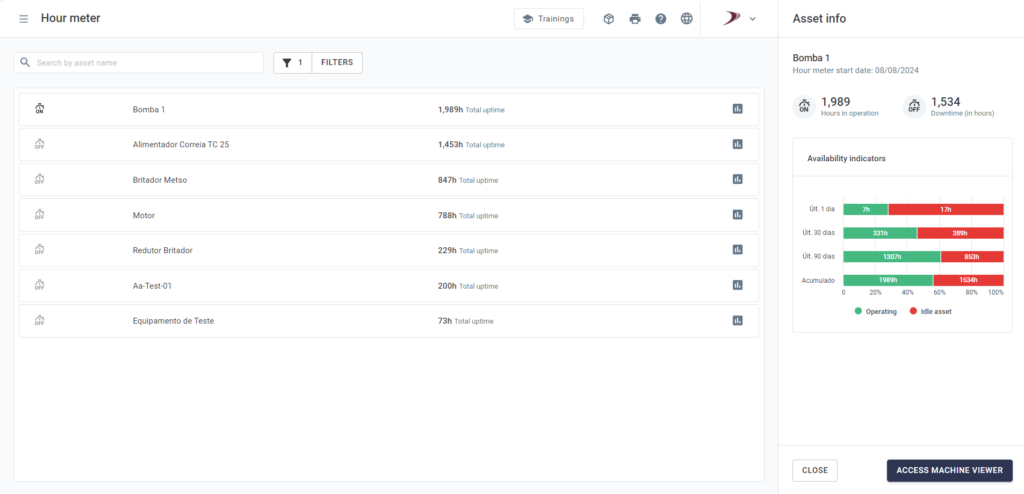
Tracking the created hour meters has never been so easy and accurate! This new functionality was developed to simplify the visualization of operation and downtime hours of your assets, offering a much more efficient and practical maintenance management routine.

Why is this amazing?

Now you have two simple and effective ways to monitor the recorded hours:
1️⃣ Machine Viewer:

  • View the total operation and downtime hours in an intuitive format (Hours:Minutes).
  • Discover when the hourmeter was created or reset by hovering over the hour icon.

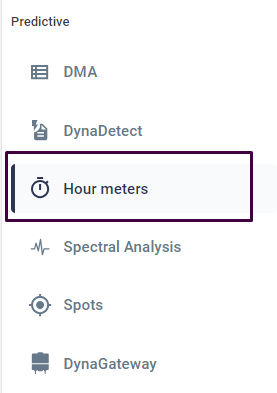
2️⃣ Hour meter Menu (located in the platform’s side menu)

  • Quickly find your assets with advanced search and filters, including by class, business risk, and hours in operation.
  • Access detailed information such as machine status (active or idle), accumulated hours, and charts consolidating data over custom periods (1 day, 30 days, 90 days, and cumulative).

💡 Soon, the hour meter will be directly available in DynaNeo, offering even more convenience and integration. Stay tuned!

Don’t waste time and try this new feature that will revolutionize how you monitor your assets. 🛠️

——————————————————————————————————————————————–

🌟 Make User Management Even More Practical and Efficient!

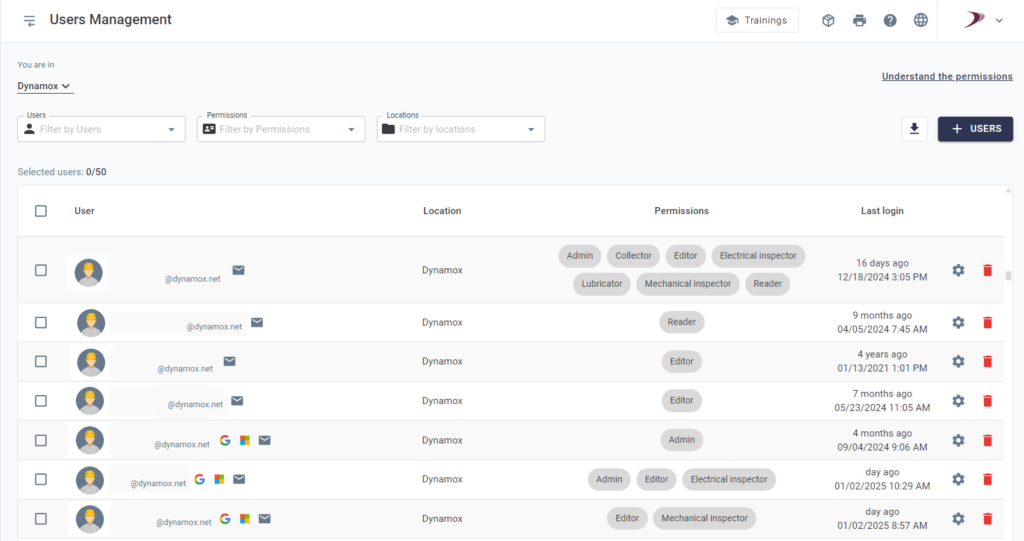
Simplify adding new users to your plant and manage permissions quickly and accurately with the new User and Permission Management interface.

Modern and Intuitive Interface:

  • Centralized navigation makes your experience more fluid and straightforward.

Full Control for Administrators:

  • View the user list, their locations, and assigned permissions.
  • Grant or edit permissions and invite new members with just a few clicks.
  • Remove access as needed.

Personalized Experience for Other Users: View only your permissions and locations clearly and objectively.

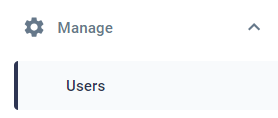
🖱️ How to access?

In the side menu, click “Manage > Users” and explore all the new features!

👉 Try it now and discover how user and permission management can be simple, agile, and efficient!

——————————————————————————————————————————————–

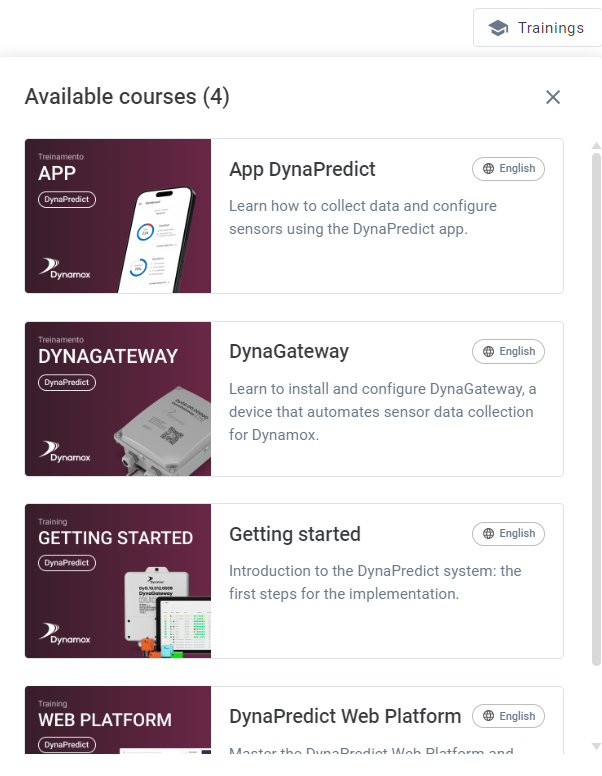
🎓 Discover the Training Platform!

Keeping up with all the training on the DynaPredict Platform has never been easier! With the Training Platform, you have simplified access to all available courses, directly from the platform menu.

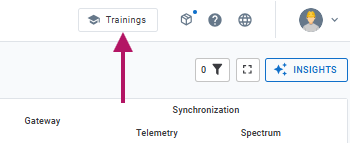
💻 The new “Trainings” button in the header allows you to quickly and intuitively view the list of available training in your language.

With a single click, a dropdown list will appear, showing all available training. Best of all: each link takes you directly to the desired training page!

  • 🎯 Quick and Hassle-Free Registration: Registration confirmation is quickly handled by the Dynamox team, ensuring training sessions happen without delays.

🌟 With the Training Platform, Dynamox provides a smooth and obstacle-free learning experience. Don’t waste time and take the opportunity to learn about our solutions in a simple and straightforward way!

——————————————————————————————————————————————–

👉 New Feature in Asset Risk Classification!

It’s now even easier to identify and prioritize critical assets for your business success! With the Asset Risk Classification feature, your operation gains more efficiency and safety, aligning with best asset management practices, such as ISO 31000 and ISO 55000 standards.

Why is this feature essential for you?

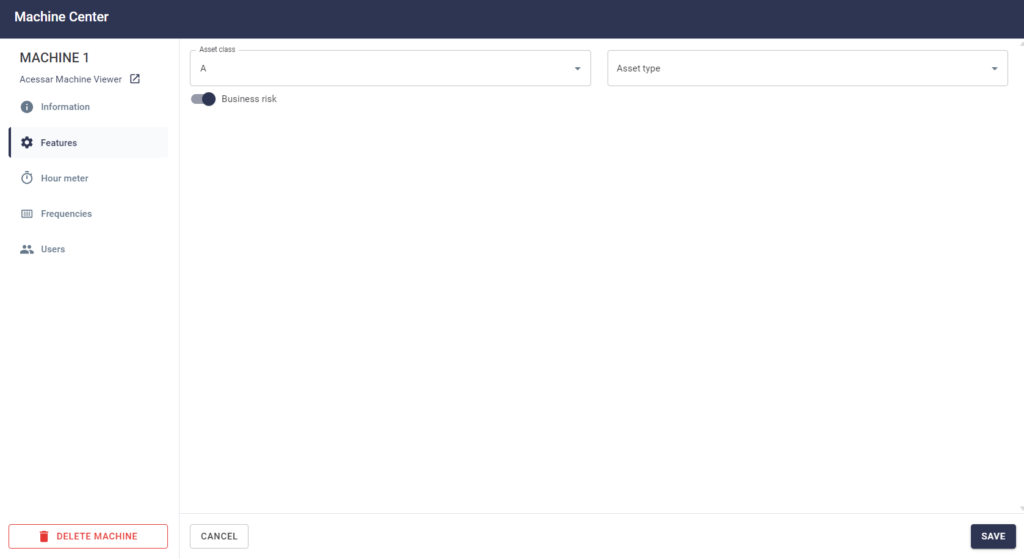
  • Clear Differentiation: Quickly identify if an asset poses a Business Risk or has a Criticality Class (A, B, C, or D).
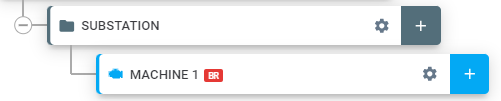
  • Strategic Visibility: Assets classified as Business Risk are highlighted with the “BR” tag, facilitating prioritization and monitoring.

🔧 Simple and Practical Configuration:

  • When registering or editing assets, enable the Business Risk field in the “Characteristics” tab.
  • Choose the Criticality Class in the corresponding menu.

💡 Transform Data into Decisions:

By combining the ABC Classification methodology with Business Risk identification, the DynaPredict Platform allows you to prioritize resources and attention exactly where they are most needed, ensuring operational continuity and reducing losses.

This is the evolution of asset management you need for 2025! 🚀
Try it now and take your maintenance and reliability strategy to the next level.

WEB: December/2024

The new version of the DynaPredict Web Platform is now available. Check out the main functionalities you can explore.
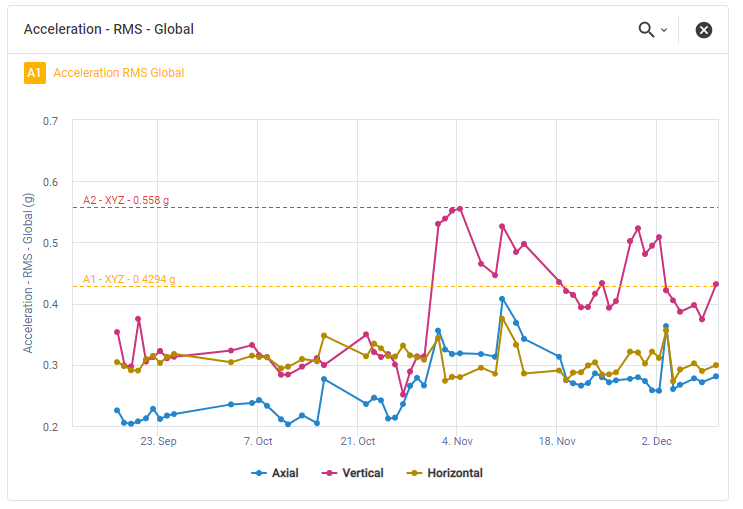
🌟 Visualization of Alerts on Charts

You can now easily visualize the alert levels directly on the graphs. This new feature guarantees an even more intuitive and optimized experience for monitoring your assets.

This new visualization allows you to identify the current status of alerts directly in the graphical interface. If there are multiple alerts configured for a metric, the platform will always highlight the most critical alerts first when analysing them.

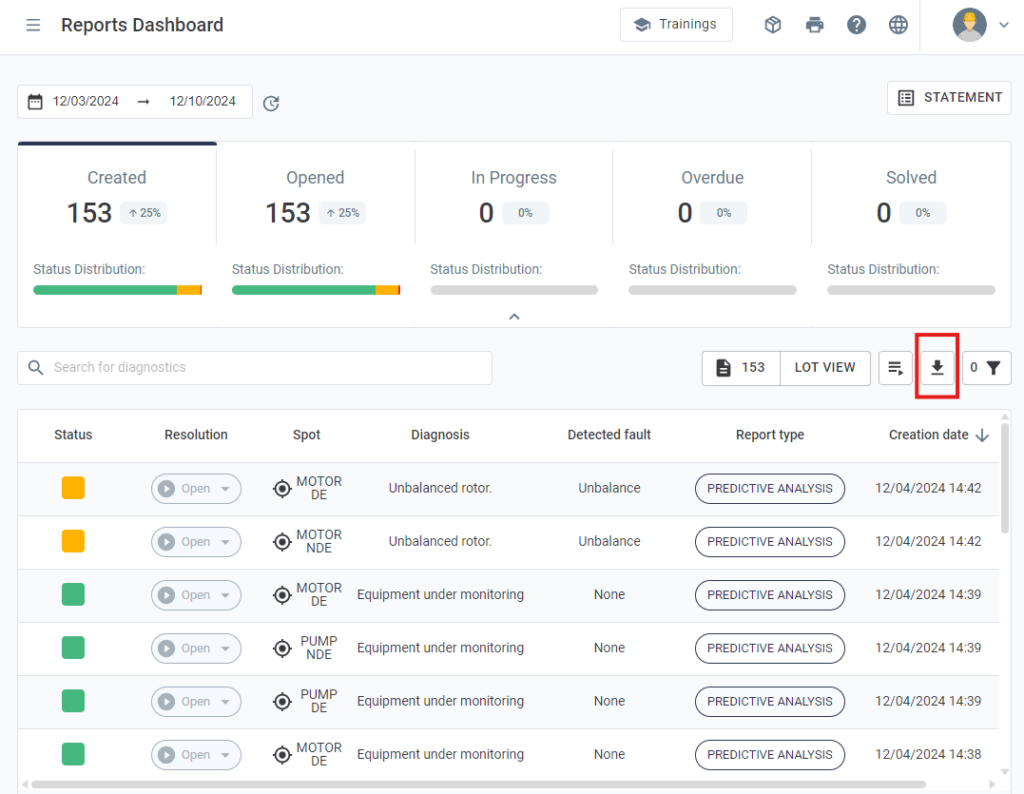
📄 Export reports in .CSV

Export the complete data of your reports directly from the dashboard screen:

With this new feature, you can export information such as status, diagnosis, recommended actions and much more to .CSV format.

Make it easier to access and analyse your reports in a more practical and personalized way!

WEB: November/2024

The new version of the DynaPredict Web Platform is now available. Check out the main features you can explore.

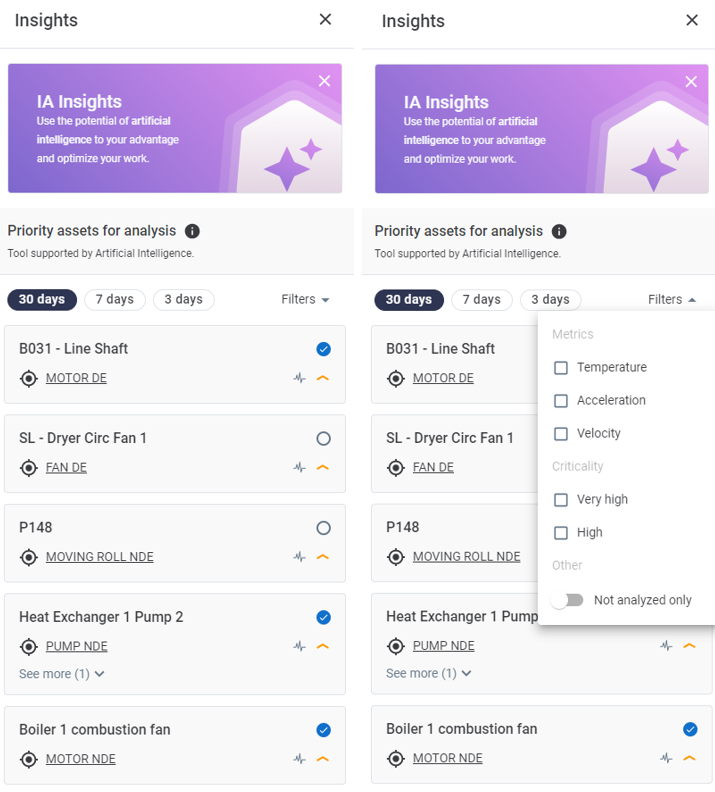
 What’s new in Insights

The Insights tool has a new look, with advanced AI that analyzes the telemetry metrics of each sensor to identify important patterns and predict relevant trends, based on three days of data. The tool presents an ordered list of assets in operation, highlighting those with possible anomalies.  

Why use Insights?

Check the machines that are trending most critically 

Use the machine-by-machine view to see the most critical machines and the number of trending spots, and create analysis tactics to ensure that all points are analyzed.

Stay informed about your team’s performance 

Use the analysed button and the unanalysed filter to see which insights are being addressed and which ones have yet to be seen. This functionality helps you stay informed about your team’s current performance. 

 Choose your best metric for tracking anomalies

Use the Metrics filter to select only certain types of insights. With this feature you can prioritize your actions based on the best metric you want to analyze.

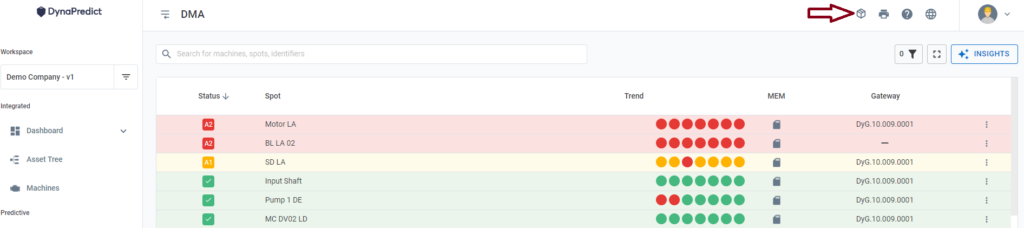
To access Insights, you can still use the button at the top right of the DMA.

AI – RPM Reader 

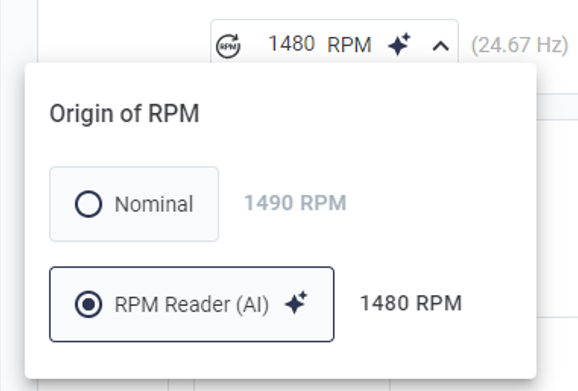
Our platform now features AI technology that automatically identifies the RPM value in a spectrum displayed in the graph on the Spectral Viewer page.

This functionality is activated whenever the analyzed asset meets the criteria required for the calculation.

RPM Reader with AI aims to increase the effectiveness of spectral analysis, providing more precision when detecting and analyzing information, which will help you carry out a more assertive and efficient analysis.

How does it work?

The RPM field will initially display the nominal value previously configured on the machine. You can choose to update this data with the RPM suggested by the AI, directly on the spectral graph.

Important: the value generated does not replace the machine’s original configuration. For each analysis, the reading will have to be taken again.

The criteria for calculation is RPMs between 600 and 5,000.

WEB: October/2024  

The new version of the DynaPredict Web Platform is now available. Check out the main features you can explore.  

  • Spot comparison – telemetry  

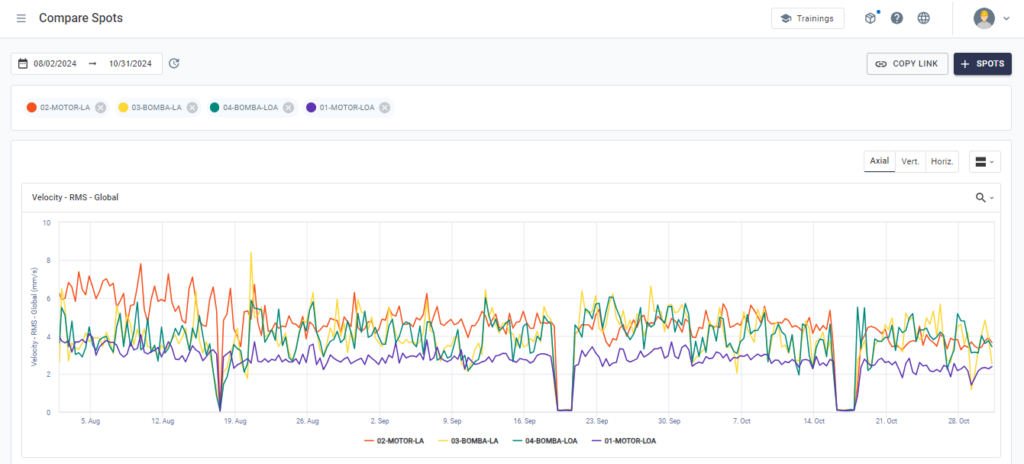
Now, by clicking on the “Go to spot comparison” button in the Spot Viewer, you can simultaneously analyze telemetry data from up to 8 spots in a single metrics chart.  

To compare multiple spots, click on the spot comparison button on the spot viewer. In the asset tree that will open, select up to 8 spots from the machine associated with the spot you were analyzing by clicking on the “+” button next to the spots. 


Next, you will be directed to the page where you can browse the available telemetry graphs, remove or add new spots and change the analysis period:   


  • One-click training platform 


We’ve made our solution usability training platform available to you in just one click. If you haven’t registered, just click on “sign up” and we’ll approve your access.   

 If you have any questions about our training, please contact our support team.   

Android App: October/2024 v4.33 

The new version of the DynaPredict app is now available! Check out the main update: 

Route with Multiple Frequencies 

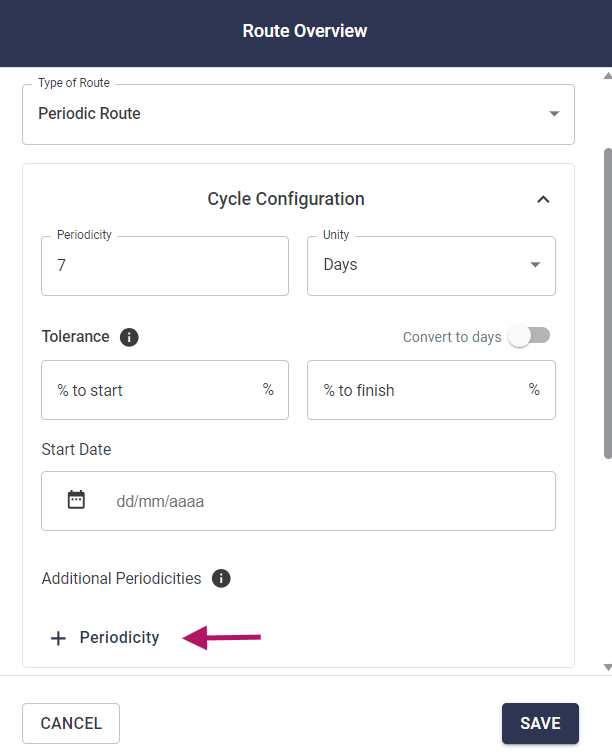
To optimize the sensitive inspection routes for inspectors, we are introducing this new feature that allows users to add various frequencies to their route. This way, the collection of spots and checklist answers for an asset can be included in a single route but assigned based on the necessary frequencies. 

On the Web Platform, in the Route Overview, a “main” frequency is configured, and multiple frequencies can be added to it. The “+ Frequency” button is used to include them. 

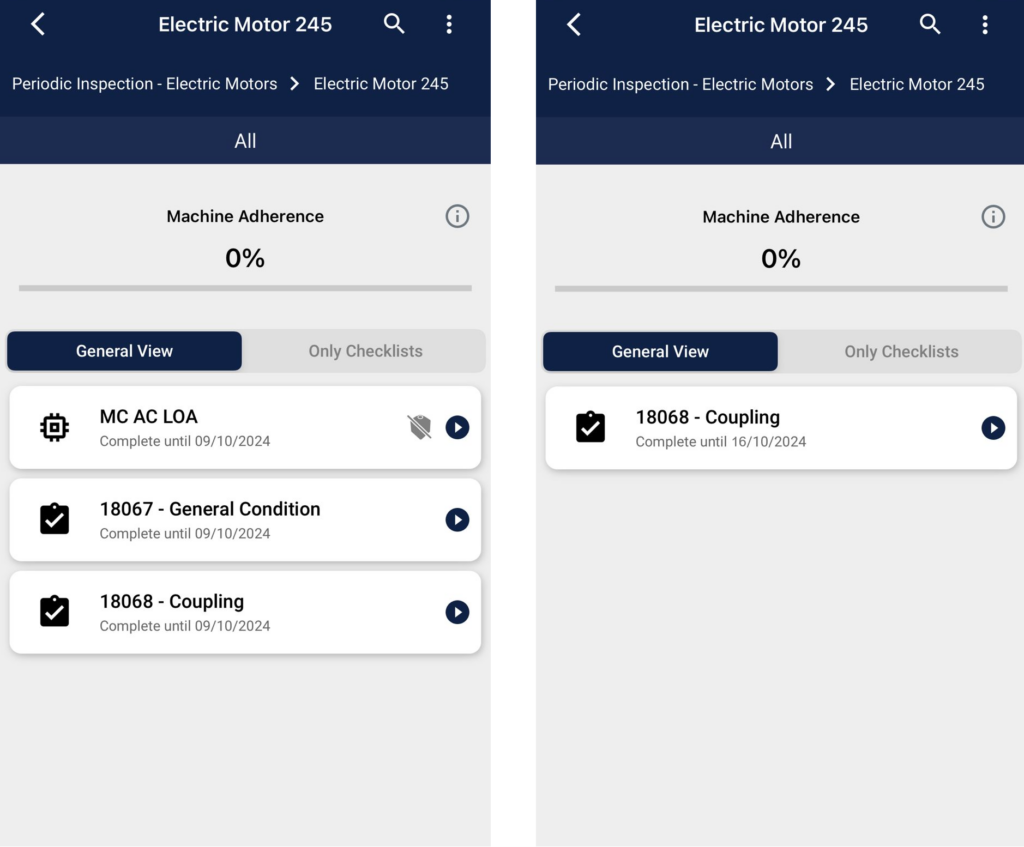
Upon accessing the app, only the route items with an open cycle will be visible. In a route with weekly and bi-weekly checklists, for example, it is possible that only the weekly route or both will be available. 


WEB: September/2024

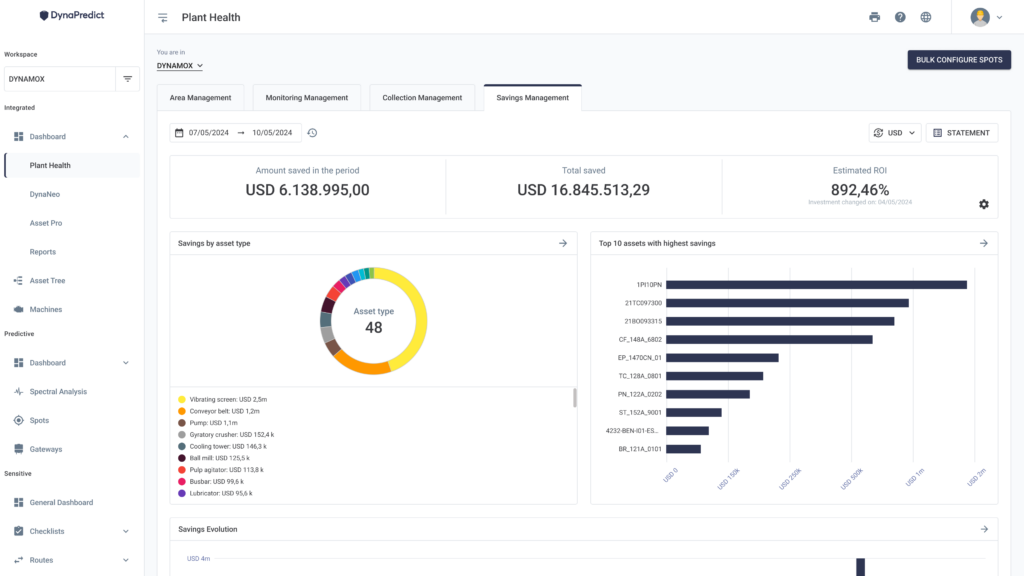
Savings Management 

Now, users with Administrator profiles on the platform can add economic details related to asset failure events when resolving a report. By entering the values for the real scenario and the hypothetical scenario (without the early detection of the failure), the system will automatically calculate the savings generated and provide a detailed breakdown (man-hours + production hours). This data feeds into a dashboard that gives a complete view of the economic impact generated by your results with Dynamox’s solution. 

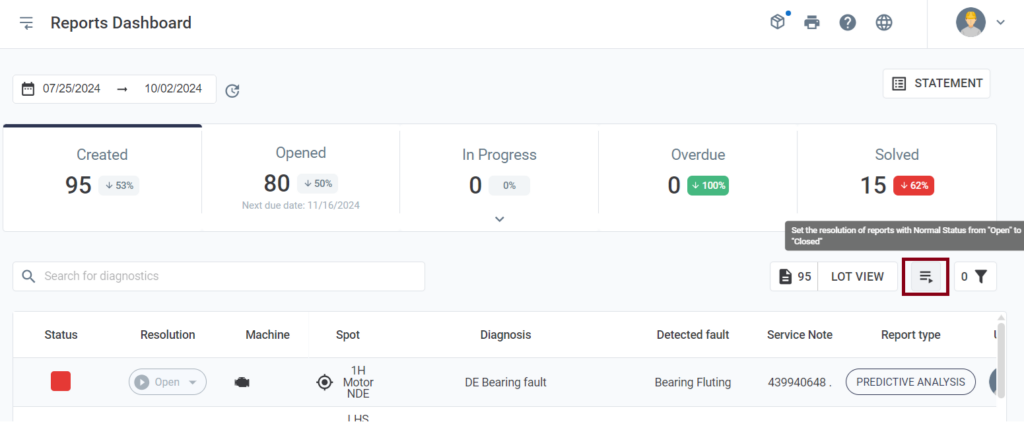
Bulk Report Closure 

To streamline the process of resolving reports with a normal status (green) by changing them in the “Resolution” column from “Open” to “Resolved,” we have introduced the bulk report closure feature. To use it, simply click the designated button on the Report Dashboard. 

WEB: September/2024   

The new version of the DynaPredict Web Platform is now available. Check out the main features you can explore.    

  – Collection Management  

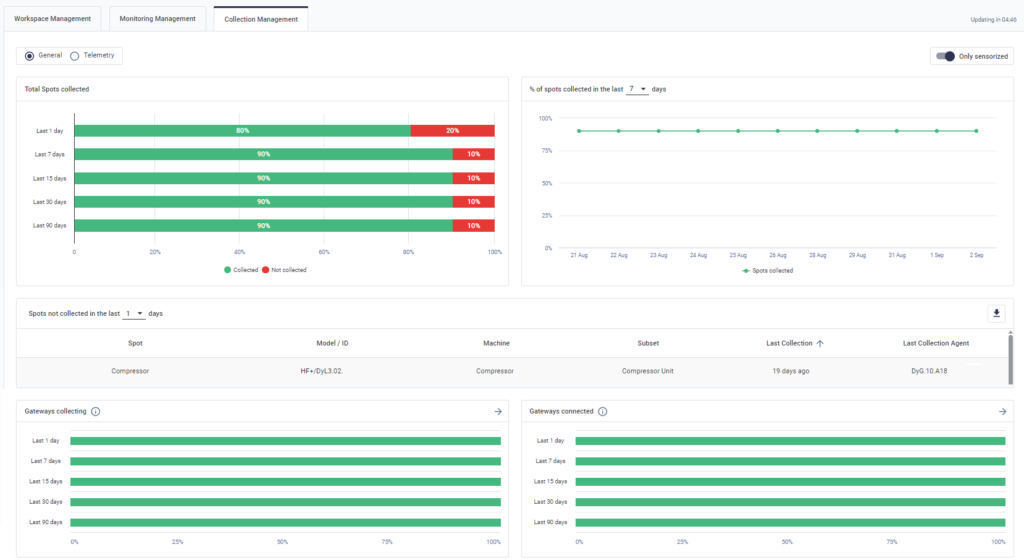
  Now, all the information related to your sensor collections is available on a single screen.   

In the Plant Health area, under the Collection Management tab, you’ll find a centralized view for monitoring the successful transmission of information from your equipment to the Web Platform.    

Use this screen to check which spots are not collecting data, check which gateways are connected and collecting, among other essential information for monitoring.   

At the top of Collection Management, you can choose between the “General” and “Telemetry” filters. With “Telemetry” selected, all it takes is one telemetry collection for the status to be marked as “collected”. With the “General” filter, the spot must have both telemetry and spectral collection to be considered “collected”.   

Finally, it is possible to export the information in .CSV, making it easier to analyze and integrate the data into other tools and systems.  

Access your Web Platform and explore the new Collection Management screen now! 

WEB: August/2024 

The new version of the DynaPredict Web Platform is now available. Check out the main features you can explore. 

  • Products 

It is now possible to view information about the products and their contracted quantities on the Web Platform. 

To access the “Product Management” area, simply click on the indicated button: 


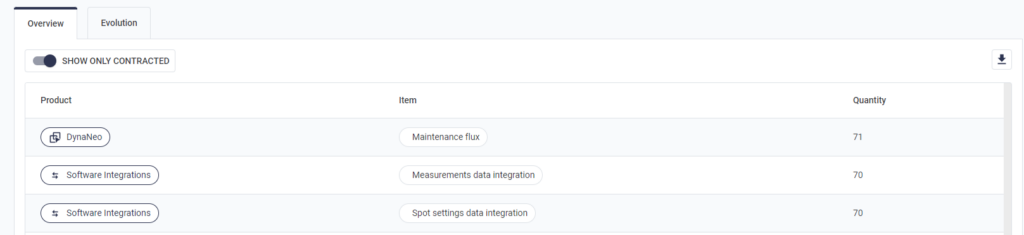
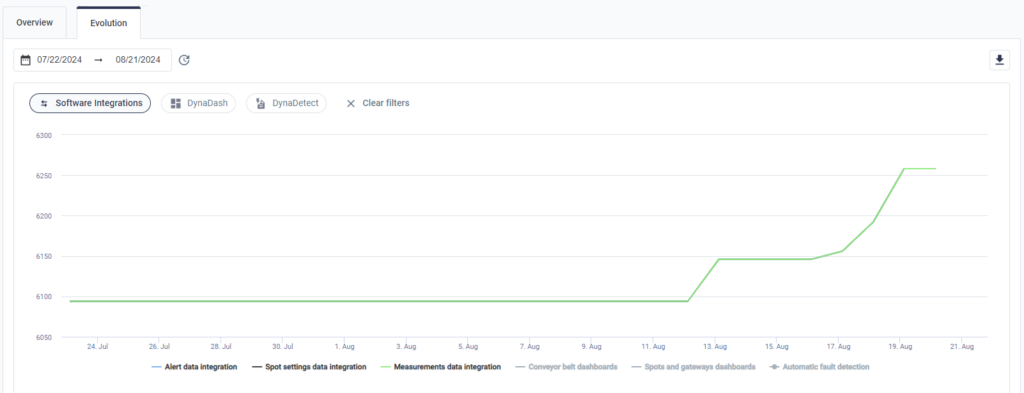
When you open this new feature, you have access to two tabs: “Overview” and “Evolution.” 

In the “Overview,” you can see 3 columns with relevant information: 

  • Product Name. 
  • Item. 
  • Quantity  


In theEvolutiontab, set the desired period and check the increase or decrease in the number of products acquired 

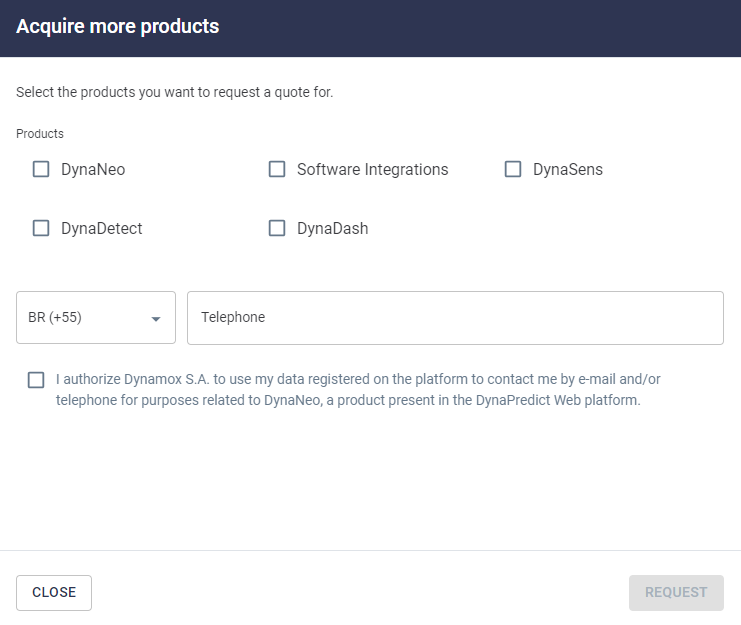
In both tabs you can access a window called “Acquire More Products.” After selecting which products you wish to purchase, the Dynamox sales team will get in touch with you.