The new update of the Dynamox App for Android is now available! 📱
In this edition, we bring exciting news about Dynamox Lens, Dynamox’s thermographic device that continuously monitors the temperature of your assets. 🌡️✨
🆕 Dynamox Lens Configuration via App
To validate the camera positioning and set parameters related to the infrared image of the Dynamox Lens, it was previously necessary to start the device’s configuration mode physically using the button.
Now, with the new update, you can access this feature remotely through the Dynamox App! 🌐📱
🔍 How can I use the new functionality?
The user must log in to the app, go to the home screen, and open the main menu located at the bottom of the screen.
In the menu, select the “Lens” option to start searching for nearby devices. Once the desired device is found, select it by clicking on its identifier.
Next, the user will be directed to the configuration pages, where it’s possible to create regions, adjust object parameters, and view the thermogram, ensuring the correct positioning during device installation. ✅
🤔 Haven’t met Dynamox Lens yet? Learn more by clicking here. ⬅️
Update now and enjoy the new features available in the Dynamox App! 🌐
For any questions, please contact Dynamox Technical Support: suporte@dynamox.net
The new update of the Dynamox App for iOS is now available! 📱
In this edition, we bring exciting news about Dynamox Lens, Dynamox’s thermographic device that continuously monitors the temperature of your assets. 🌡️✨
🆕 Dynamox Lens Configuration via App
To validate the camera positioning and set parameters related to the infrared image of the Dynamox Lens, it was previously necessary to start the device’s configuration mode physically using the button.
Now, with the new update, you can access this feature remotely through the Dynamox App! 🌐📱
🔍How can I use the new functionality?
The user must log in to the app, go to the home screen, and open the main menu located at the bottom of the screen.
In the menu, select the “Lens” option to start searching for nearby devices. Once the desired device is found, select it by clicking on its identifier.
Next, the user will be directed to the configuration pages, where it’s possible to create regions, adjust object parameters, and view the thermogram, ensuring the correct positioning during device installation. ✅
🤔 Haven’t met Dynamox Lens yet? Learn more by clicking here. ⬅️
Update now and enjoy the new features available in the Dynamox App! 🌐
For any questions, please contact Dynamox Technical Support: suporte@dynamox.net
The October update of the Dynamox Web Platform is now available! 🌐✨
An edition full of new features made especially for you! This release brings exciting updates to Spot Viewer Analysis and Belt Conveyor Fault Detection!
Notes During Analysis in Spot Viewer
With this new update, users can now leave comments directly on the Spot Viewer spectral viewer, available while executing routes! 💬🔍
In this version, the feature allows users to quickly add technical observations during analysis, encouraging information sharing between team members and ensuring continuity in technical work. 🔄
🔍 How can I use the new feature?
The analyst starts the analysis route and accesses Spot Viewer as usual. When viewing the spectrum through the preview, a comment section is now displayed directly in the interface:
Additionally, comments are linked to the data collection and made available to other team members. This way, users can strategically use comments to ensure smoother analytical continuity! 💡
Conveyor Belt Fault Detection – DynaDetect
In this edition, we also bring an update to DynaDetect! The tool now performs fault detection in hydraulic couplings, expanding its analysis coverage for belt conveyors! 📈
Through early fault detection powered by AI trained on multiple components, users gain even greater control over the health of their critical assets, preventing catastrophic failures and ensuring equipment reliability. 🚀 ️🌟
Use the new features now, already available on the Dynamox Platform! 🚀
For any questions, please contact Dynamox Technical Support: suporte@dynamox.net
The September 2025 update of the Dynamox Platform is now available! 🌐
In this new version, we bring updates to DynaSens, Asset Tree, Public Alert APIs, Management Indicators, and DynaDetect.
🆕 New Monitoring Panel in DynaDetect
It’s now even faster to identify faults in your plant with the new monitoring panel in DynaDetect!
This version introduces a panel specifically designed for maintenance teams using the tool’s AI models to detect faults.
The tool provides a centralized panel with valuable information about your assets, connecting detection data with your team’s work and optimizing workflows.
The new panel enables your team to:
Gain visibility into team activities
Proactively identify faults and mitigate risks
Get a systemic view of asset faults and affected components
Identify undiagnosed faults more quickly
Easily validate diagnostics
View a list of identified faults
🆕 Checklist Templates in DynaSens
To simplify the DynaSens implementation process, this update introduces a list of predefined templates on the checklist creation screen.
These templates contain complete content that can be used directly or adapted to your company’s reality.
This feature ensures faster initial setup, routine standardization, and a smoother user adoption experience.
🔍 How to use the new feature?
Go to the “Checklists” tab in the side menu, click “Create,” and on the tool page, select the desired asset in the “Recommended Checklists” field and choose from the available templates:
By clicking the “play” button, you can preview the template content in detail before selecting it, ensuring it fits your needs.
After saving the selected template, the checklists will be directed to the “Manage” screen, where they can be reopened and edited as needed.
🆕 Management Indicators Update: Health Calculation Change, New Filters, and Indicator
Health Calculation Change
There will be an update to the current health calculation of indicators on the “Management Indicators” screen. Currently, indicators use spot alerts as the basis for calculation. Starting in 2026, the new calculation will use the worst alert from each machine to determine asset health.
IMPORTANT: The current calculation will be disabled in December 2025, but the new format will be available this year for users to adapt.
Class and Business Risk Filters
With the new health calculation enabled, you’ll be able to use the new class and business risk filters. The tool allows filtering information for machines with associated business risk or class.
Percentage Indicator of Machines in Alert Without Open or Ongoing Reports
A new indicator will also be available with this update. Users can now view the percentage of machines in alert without open or ongoing reports. This update aims to provide greater visibility into machines in alert that haven’t been analyzed.
🆕 Public Alert API
To wrap up this month’s updates, a new Alert API is also available!
With this new API, users can view the alert history related to a specific spot metric. The update is available at: API Dynamox – Alerts
Start using the new updates now, already available on the Dynamox Platform! 🚀
Any questions? Contact Dynamox Technical Support: suporte@dynamox.net
The Dynamox Platform August 2025 update is now available! 🌐
In this new version, we bring updates related to the Side Navigation through the Asset Tree, Spectral Preview in Spot Viewer, and Tab Preferences in Spot Viewer.
🆕 Side Navigation through the Asset Tree
Aiming to make the visualization of the Dynamox Platform tools even more practical, the new update allows users to navigate through the asset tree in a side panel.
🔍 How can I use this new feature?
It is already available in beta version on the Asset Tree screen. To enable it, the user just needs to activate the side navigation mode.
Once the new tool is enabled, it will be ready to use! By clicking on the asset tree icon in the platform, the tree will be available in side navigation mode, allowing navigation between machines and spots without interrupting the user’s analysis flow.
Machines classified as Business Risk will be highlighted in the new view. By clicking on them, the Machine Viewer screen will open and the selected asset will be highlighted in the asset tree.
The same occurs when clicking on a subset: the selected item will be filtered on the corresponding screen, highlighted in the Asset Tree, and displayed in the Machine Viewer page.
When selecting a monitoring point, the Spot Viewer will open so the user can start analyzing the point.
If you want to open one of the assets in a new tab, just hover over the desired point and click on the icon that will appear next to it.
IMPORTANT: The current Asset Tree access page will not be discontinued, but the access path has been modified. Now it is necessary to click the manage button, located at the bottom of the side panel.
In addition, to collapse the side panel just click on the icon in the upper right corner of the panel. It is also possible to search directly in the side panel: simply type the name of the desired item and the user will be directed to it.
🆕 Spectral Preview in Spot Viewer
This update also brings new tools to the Spot Viewer screen.
Now, when opening Spot Viewer and selecting the spectral metrics tab, the user will have access to a side panel showing the spectrum of the most recent acquisition on the axial axis. By clicking on other points, the spectrum will update to the date of the selected acquisition.
In addition, in the side panel it is possible to select the preferred axis and, by selecting the desired spectrum in the chart, the panel will update with the corresponding information.
However, this view does not include the analysis tools available in the Spectral Viewer. For a more detailed analysis, the user can access Spectral Viewer by clicking on the bottom right corner.
If there is no acquisition in the selected period, a warning will appear in the side panel suggesting refining the acquisition period to view the spectra.
🆕 Tab Preferences in Spot Viewer
To close the August updates, we present one more feature in the Spectral Viewer page.
Now users can select which tab they want to open by default, making their analysis journey easier. By hovering over the tabs, a pin icon will be available to set preferences among the telemetry, spectral metrics, and report tabs. The choice is up to the user!
🆕 Listen to Shaft Vibrations in Waveform
To wrap up the August updates, you can now listen to the sound playback of vibration data from each shaft in a waveform!
This new feature can provide additional information and valuable insights into a machine’s behavior. That’s because many types of failures can produce distinct acoustic signatures, allowing you to identify issues more intuitively.
With this improvement, we aim to help our users achieve greater operational efficiency, making condition-based maintenance more effective and reducing downtime!
Start using the new updates now, already available in the Dynamox Platform! 🚀
If you have any questions, please contact Dynamox Technical Support: suporte@dynamox.net
The new update of the Dynamox Platform is now available! 🌐
We bring new features related to Spot/Checklist Selection in Reports and Changes in Viewing Preferences! ✨
🆕 Reevaluate Checklists
Aiming to improve the usability of the Dynamox Platform, users can now quickly update the status of anomalies identified during sensory inspections. ✅
All of this is possible through the new checklist reevaluation feature, enhancing efficient planning for the entire team!
🔍 How can I use the new feature?
The user must log in to the Dynamox Platform and access the “Checklist Reports” page through the side menu. From there, the user should select the checklist(s) they wish to reassess.
To perform the reassessment, the following criteria must be met:
Only checklists with at least one alert can be reassessed;
A maximum of ten checklists can be reassessed at once;
The user must have permission as a Mechanical Inspector, Electrical Inspector, or Lubricator to perform this action.
After selecting the checklist(s), the user must click on “Reevaluate” and choose between the two available options:
Reevaluate via the platform, where the user answers the checklists again through the Web Platform;
Create a corrective route, where the user generates a new route to be executed using the App.
Reevaluate via the Platform 🖥️
Using this option, the user can update the criticality level of the necessary questions and attach evidence justifying the reevaluation of the item — for example, an image showing a component obstruction.
Create Corrective Route 🔧
When selecting this option, the user must define the execution interval of the route, while the content (checklists and assets) will be filled in automatically. The route will be automatically assigned to the user performing the reevaluation.
Additionally, the new update now also includes a Status Timeline, which shows the number of alerts issued by the same checklist during the selected period.
🆕 Spot/Checklist Selection in Reports
Historically, when creating predictive analysis reports by machines, subsets, or components, users were not able to select the analyzed spot for diagnosis.
Now, the new update allows the selection of one or more spots in reports by equipment! 📝
Depending on the report’s origin, the spot may come pre-selected or a list of spots may be available for selection. It’s important to note that the location step remains unchanged!
In the information step, a “Spots” field has been added, where you can select the spot(s) whose analysis contributed to reaching that diagnosis. The report’s location is also available in the upper corner.
If the machine level was selected in the location tab, all associated spots below will be displayed in the list of available spots for selection — including those linked to subsets/components at lower levels.
Additionally, in sensitivity analysis reports, it will be possible to associate checklist responses.
🆕 Change in Viewing Preferences
Still in this update, we bring an improvement to the viewing preferences of the Spot Viewer.
Now, users can permanently add and customize the charts they want to view, further optimizing their experience!
🔍 How can I use the new feature?
The “add chart” button now adds the chart to the view in a persistent way. In other words, once selected, the chart remains in the Spot Viewer across all future user sessions.
Additionally, to permanently remove charts, a button has been added to the user’s chart view. After deletion, an option to undo the action will be displayed.
Start using the new updates now – already available on the Dynamox Platform! 🚀
If you have any questions, please contact Dynamox Technical Support: suporte@dynamox.net
Check out our new features and tools, made especially for you. ✨
🆕Dashboard and Menu Redesign
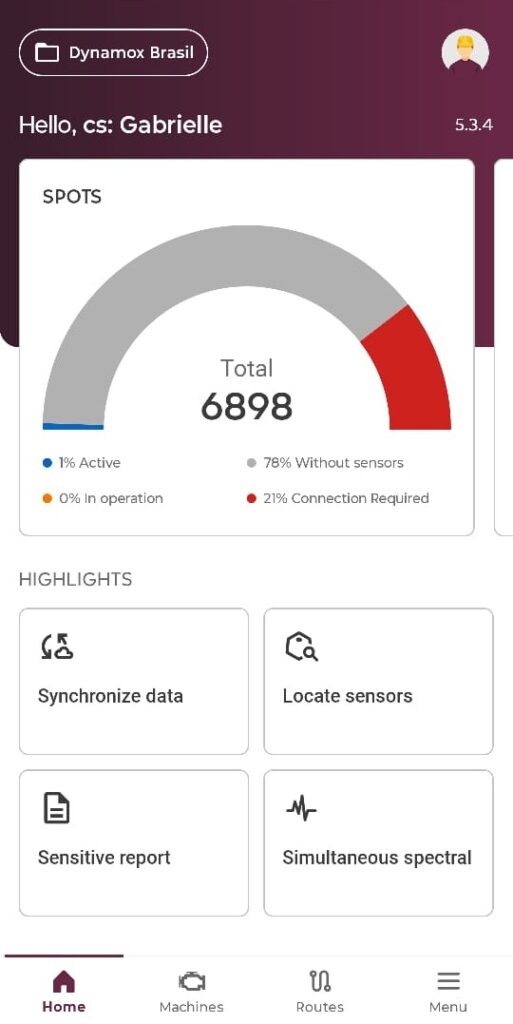
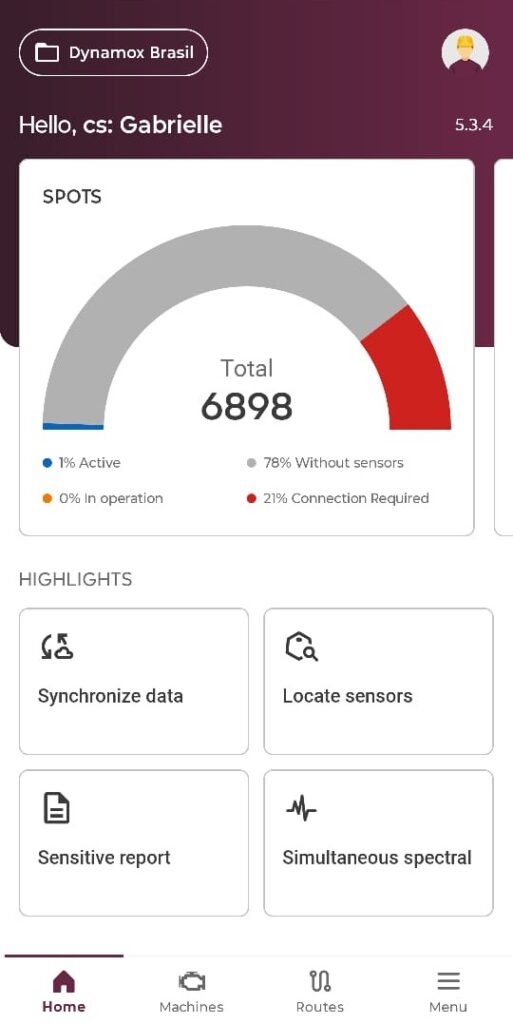
The new app update brings a complete redesign of the dashboard screen!
The screen has been fully revamped, with functional visuals aligned with user needs:
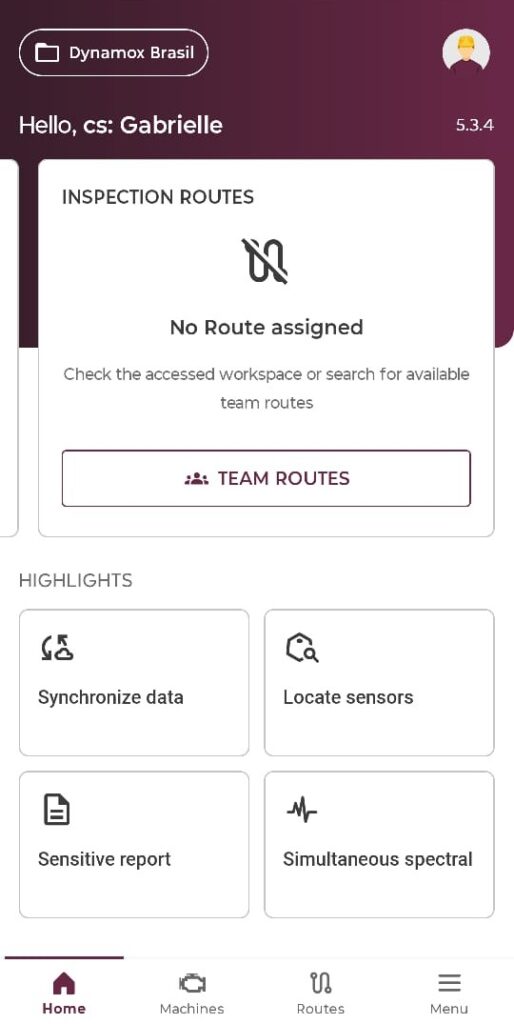
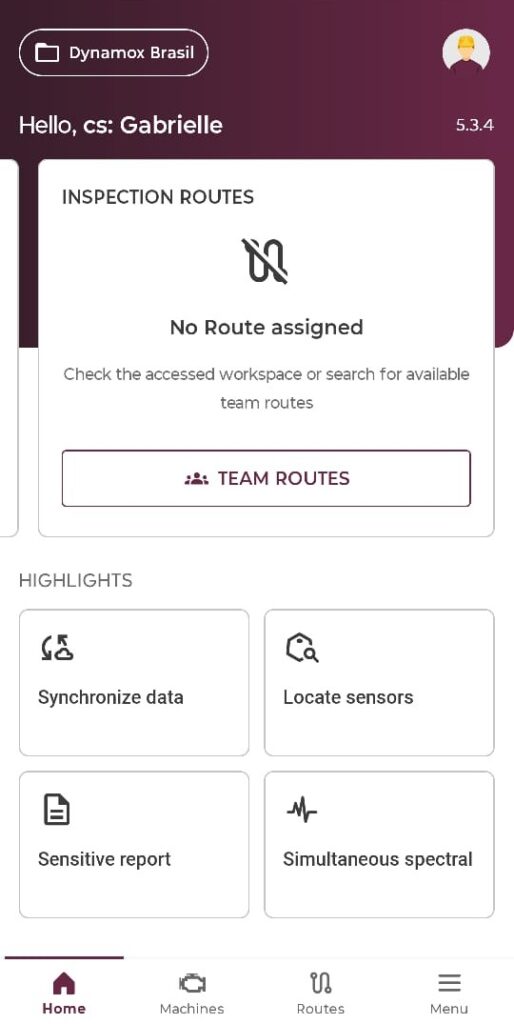
Additionally, if the user does not have the DynaSens module, the new dashboard will display an informative screen that redirects to the website:
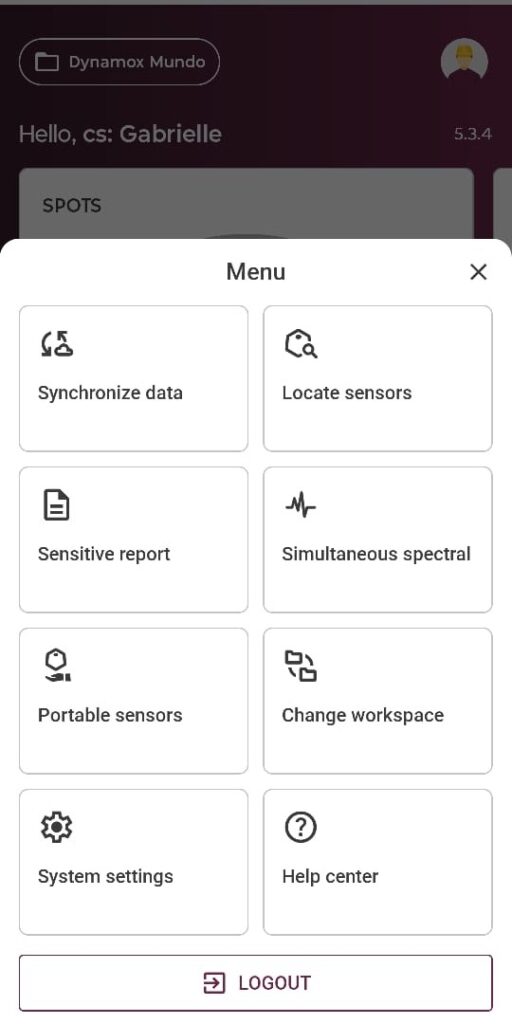
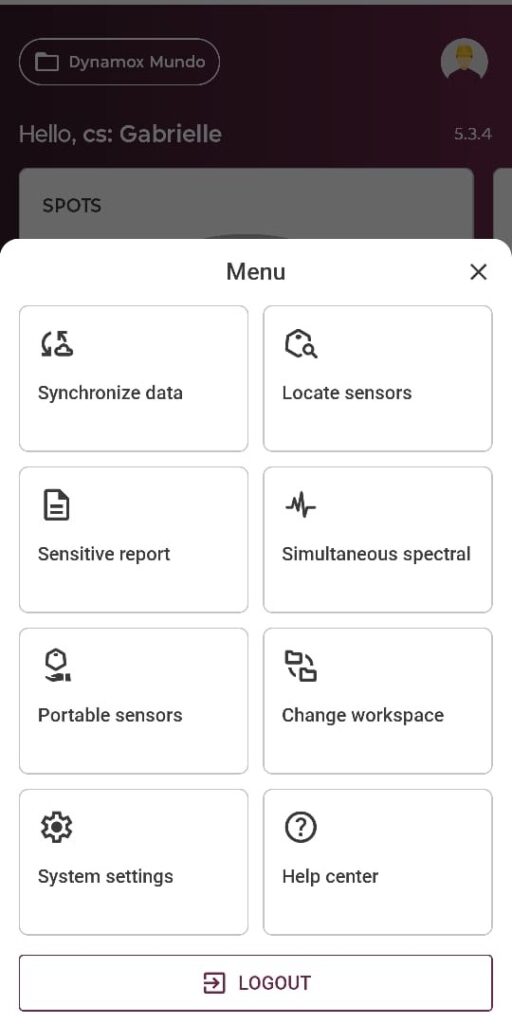
New Menu and Access 📲
With the new update, the old menu has been removed and placed at the bottom of the app, providing quick and easy access to the main screens and features. It also improves visibility and available actions for users:
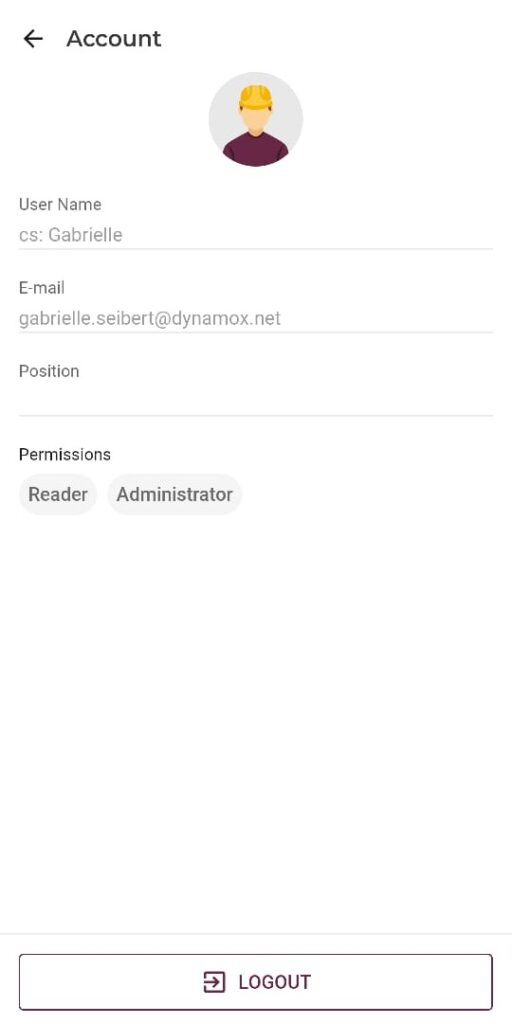
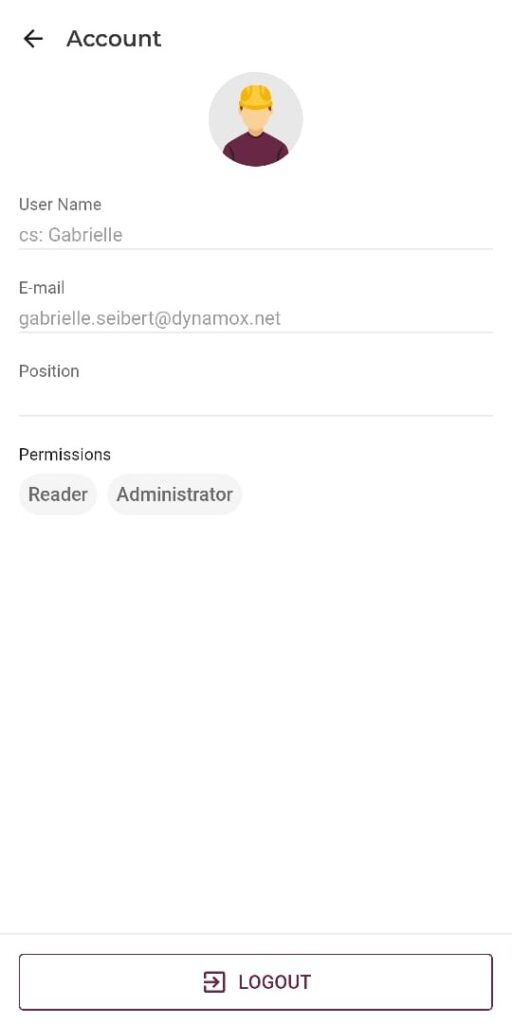
We also have a new account access screen! Now users can add information such as name, position, and email:
The buttons for creating a machine and accessing team routes have also been updated.
On the user’s first access after the update, we’ll show the new features and changes in a simple way.
🆕Checklist Response Report
To bring even more possibilities to our app, it’s now possible for the executor to generate a report directly from the app after identifying an alert during an inspection routine!
💡 How to use the new tool?
The executor should go to the Sensitiva area in the app, select the route they want to execute, and access a checklist.
After completing the checklist, the user will receive a “Checklist Completed” notice and the option to Create Report. If the user selects this option, they will be directed to the Report screen.
The Report will come with the fields Asset, Checklist, Status, and Attachments pre-filled. After completing the remaining information and saving, the user will return to the step of the route they were on.
🔔 Important: Only the Asset and Checklist fields will not be editable.
If the user uses the “Checklists Only” function, the Create Report option will appear between one checklist and another.
The executor also has the option to create reports after completing the route(s), by accessing them in view mode.
Start using the update now: already available on the iOS app! 🚀
Check out our new features and tools, made especially for you. ✨
🆕Dashboard and Menu Redesign
The new app update brings a complete redesign of the dashboard screen!
The screen has been fully revamped, with functional visuals aligned with user needs:
Additionally, if the user does not have the DynaSens module, the new dashboard will display an informative screen that redirects to the website:
New Menu and Access 📲
With the new update, the old menu has been removed and placed at the bottom of the app, providing quick and easy access to the main screens and features. It also improves visibility and available actions for users:
We also have a new account access screen! Now users can add information such as name, position, and email:
The buttons for creating a machine and accessing team routes have also been updated.
On the user’s first access after the update, we’ll show the new features and changes in a simple way.
🆕Checklist Response Report
To bring even more possibilities to our app, it’s now possible for the executor to generate a report directly from the app after identifying an alert during an inspection routine!
💡 How to use the new tool?
The executor should go to the Sensitiva area in the app, select the route they want to execute, and access a checklist.
After completing the checklist, the user will receive a “Checklist Completed” notice and the option to Create Report. If the user selects this option, they will be directed to the Report screen.
The Report will come with the fields Asset, Checklist, Status, and Attachments pre-filled. After completing the remaining information and saving, the user will return to the step of the route they were on.
🔔 Important: Only the Asset and Checklist fields will not be editable.
If the user uses the “Checklists Only” function, the Create Report option will appear between one checklist and another.
The executor also has the option to create reports after completing the route(s), by accessing them in view mode.
Start using the update now: already available on the Android app! 🚀
The new update of the DynaPredict Web Platform is now available! 🌐
The platform brings new features related to the Gateway Report, Public Alerts API, and Spectral Requirement Threshold Settings. ✨
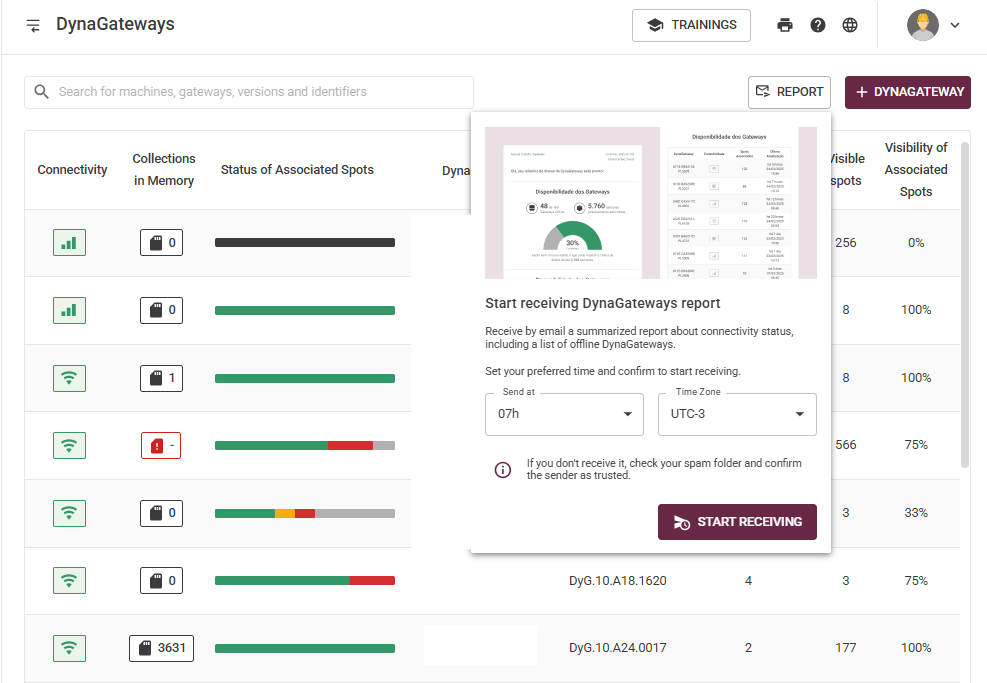
🆕 Offline Gateways Report
The new platform update introduces a new feature: Offline Gateways Report!
Now, platform users can receive email notifications for DynaGateways that have been disconnected in the last 24 hours. 🕒📄
Users can access this tool on the “DynaGateways” page via the “Report” button:
After subscribing the desired Gateways in the new configuration, the user will receive daily emails (one email per day) with reports on the status of these devices.
This new update is designed to support quick decision-making in case of offline collectors, ensuring that users do not lose important data.
Additionally, there is always the option to unsubscribe from the email notifications if the user no longer wishes to receive them.
🆕 Public Alerts API
Bringing even more convenience to your daily routine, the new update expands the range of data available through Dynamox’s Public API!
With the new endpoint, it is now possible to access alert data and integrate it with other platforms. 🖥️
Remember that through the APIs, it is also possible to access processed information from the platform, user-created reports, specialized metrics, AI-based diagnostics (DynaDetect), and inspection route reports from DynaSens.
Another update focused on optimizing activities and increasing operational agility, enabling access to relevant data—such as alerts—across different environments! 🚀
🆕 Bulk Configuration of Spectral Requirement
With the new update, we also bring improvements to spectral requirement configuration! Now, users can edit the spectral requirement settings for a large number of routes all at once.
How can I use the new feature?
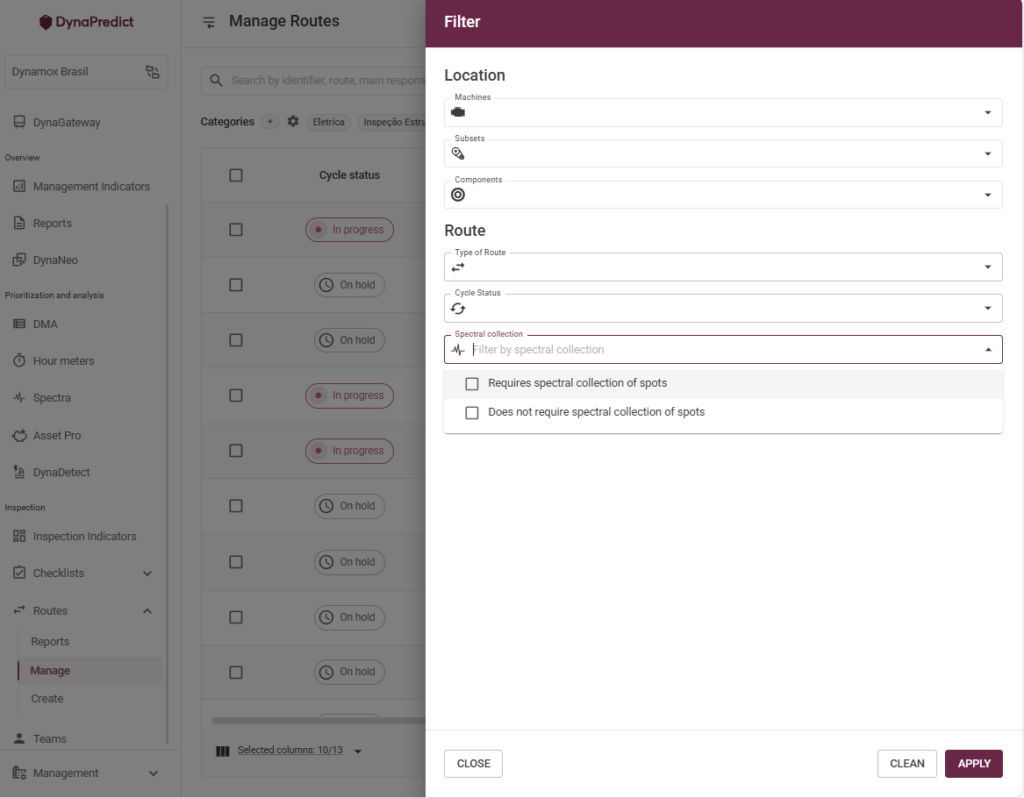
🔍 Filter
The user must access the “Manage Routes” page within the Web Platform. On this page, users can now filter routes according to the configured spectral requirement using the “Filter” button:
Bulk Route Configuration
To make the process of editing existing routes more user-friendly, users now have the ability to bulk edit spectral requirements directly from the “Manage Routes” page.
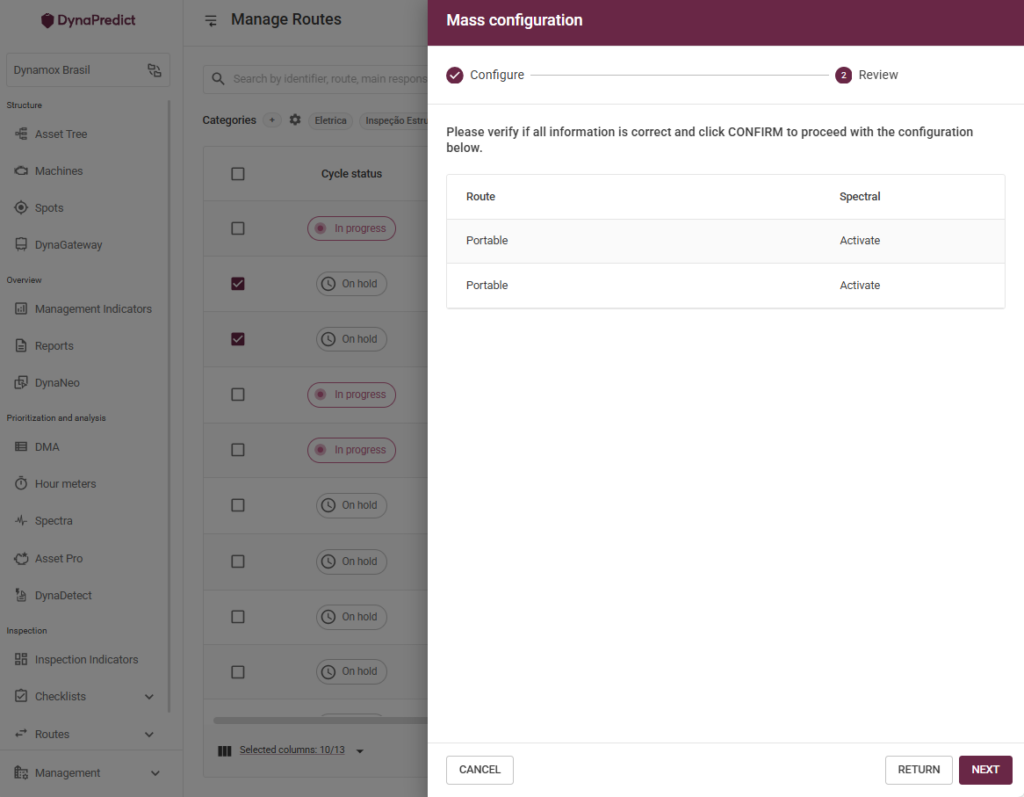
To get started, the user must select the desired routes. Once at least one route is selected, the “+ Route” button will change to a new bulk configuration button.
The user should then click the button and select the configuration they wish to apply to the routes. After that, it’s possible to review the selected changes before confirming and executing them:
📌 Note: The maximum number of routes that can be edited at once is fifty.
Start using the new updates now — they’re already available on the Web Platform!🚀
The new update of the DynaPredict Web Platform is now available! 🚀✨
The new update brings news for System Preferences and User Group Adherence.
🆕 System Preferences
Currently, the web platform has several configuration options that allow the user to customize the applications as desired. ⚙️🌐
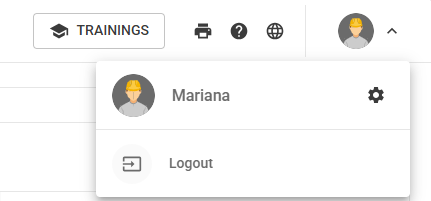
To access the settings, just click on the profile icon in the upper right corner of the page:
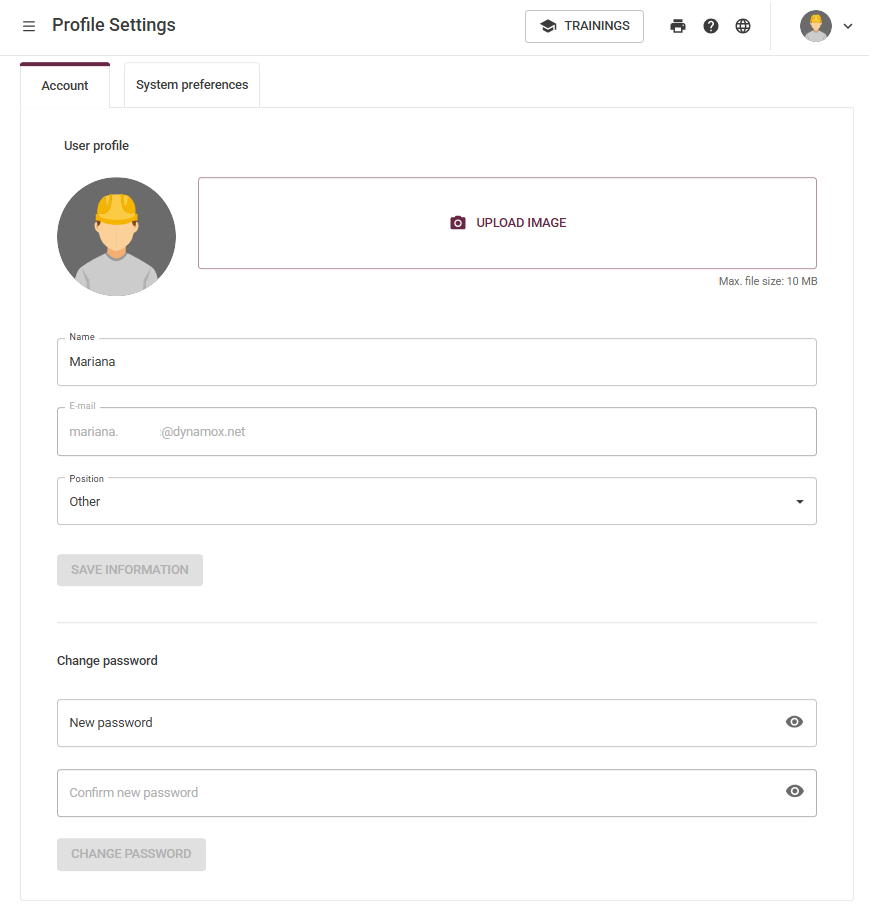
👤 With the new update, in the “Account” settings, in addition to the registration data (name, password, and profile picture) you can also fill in your job title.
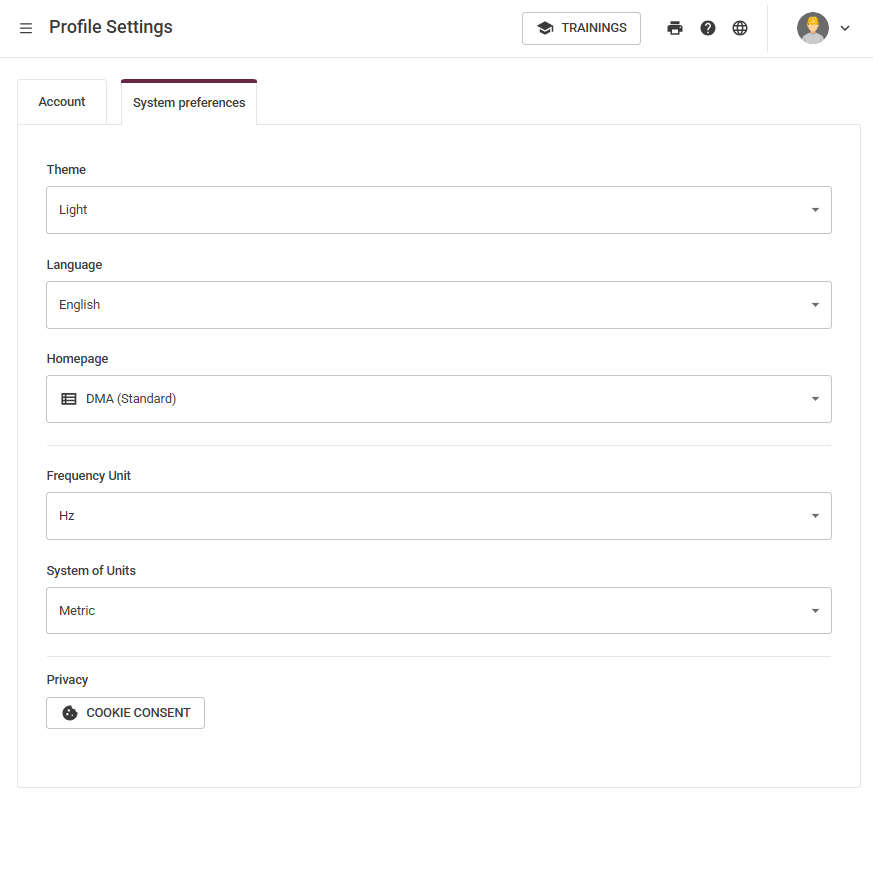
Additionally, in the “System Preferences” tab, the user can select settings such as unit system (metric or imperial), frequency unit (Hz or CPM), default theme (light, dark or according to your system) and language (Portuguese, English or Spanish). Furthermore, you can now also select your home page when accessing the platform!
🆕 User Group Adherence
The new update allows the user to save filters by permissions, subareas or users! Additionally, it is now also possible to monitor the adherence indicators and justifications of the selected user group.
👥 To view the group indicators, simply click the “Team” button available in the Side Menu. After accessing this link, the user will be directed to the “Team Indicators” page. On this page, it’s possible to view indicators such as: Total Users, Total Routes, the Team Adherence chart, the distribution of justification types in the “Justified Items” chart, and also the Individual Reports.
💾 To save filters, still on the Team Adherence page, the user can apply several filters. By clicking the filter button, a side panel will appear on the screen, where it’s possible to filter by users, permissions, subareas, and teams.
Use the update now: already available in the Android App! 🚀