Web: November | 2026

Hello,
This edition brings new Dynamox Platform features designed to make your maintenance routine more agile and your decisions more confident. See what has changed and how to apply it to your daily work.
NEW | Subassembly and component images in Machine Viewer
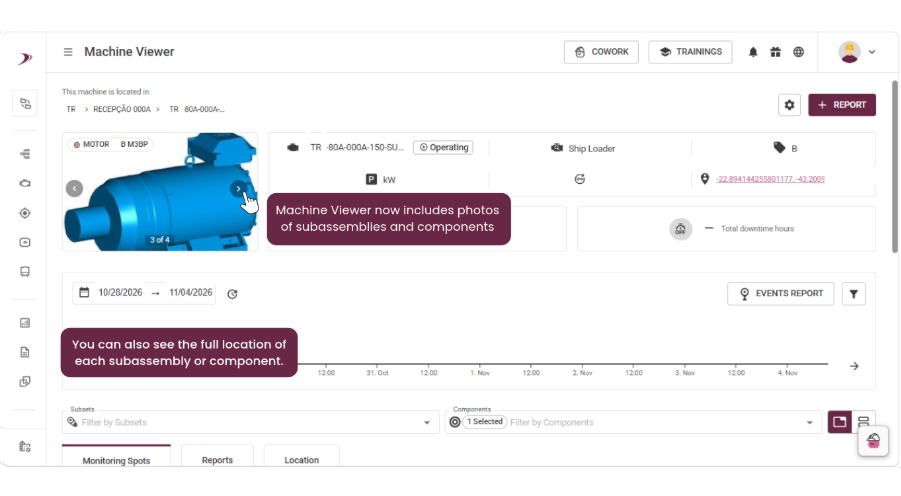
Machine Viewer now gathers, in a single card, the images of the machine and all of its subassemblies and components. You can browse through them and open each one in full screen to see it in its original size.
In practice: analysts can see the motor, gearbox or bearing housing of the point they are analyzing without opening each asset’s Central page.
Images already registered for subassemblies and components now show up automatically.
Guiding customers: many customers still don’t know they can register images for subassemblies and components, and some believed the machine image replaced the others.
It is worth reinforcing that each asset can have its own image, registered through the asset’s Central page, and that the more images registered, the more complete the visual record that guides the analysis.
NEW | 7-day GUT history in DMA
DMA now has a “GUT History” column with a timeline of the last 7 days for each machine and spot. Each day is shown in the color of the worst GUT level reached, and hovering over it displays the date and level.
The same history appears in the “GUT Calculation” section of the asset details, along with the date of the last calculation.
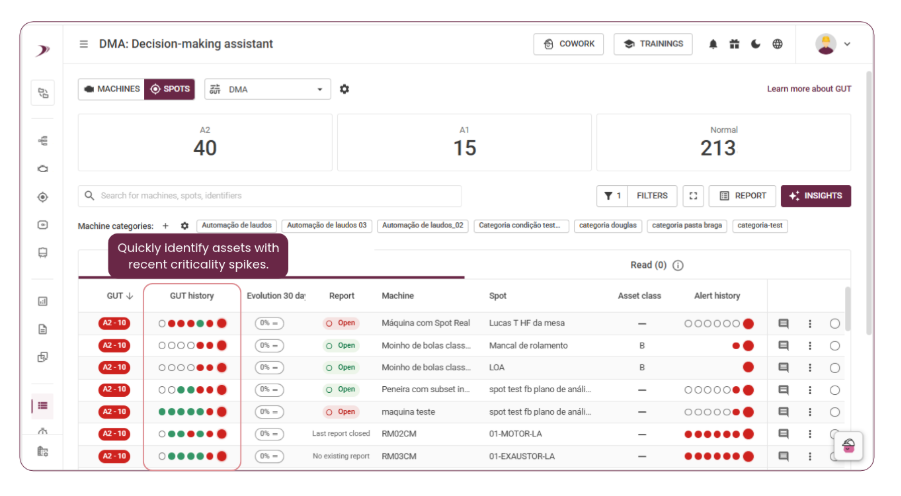
In practice: a machine that reached C3 three days ago and is at C1 today stays visible on the timeline. Recent criticality peaks no longer go unnoticed, and prioritization gains context.
- The “GUT History” column is now on by default in DMA, and the alert history column is now off by default. Users who already use the alert history keep it on, and any user can turn either column on or off. To see which alert was triggered, it is worth keeping the alert history on.
- The history follows the GUT rule applied by the user. With the DMA Default Rule, which only considers alerts, the GUT history mirrors the alert history.
- The level changes when GUT is recalculated (a new collection, a report, a change in Detect or in time in alert). For assets with less frequent collections, the same color may repeat for a few days.
NEW | Change history for GUT rules
Every custom GUT rule now has a change history, available right from the DMA rule list. Creation, edits and deletion are logged automatically, showing who made the change, when, and what changed (previous and new value). Deleted rules can also be displayed so their history can be checked.
In practice: if asset prioritization changes unexpectedly, the team can investigate the cause. This makes internal audits easier and builds confidence in the GUT model.
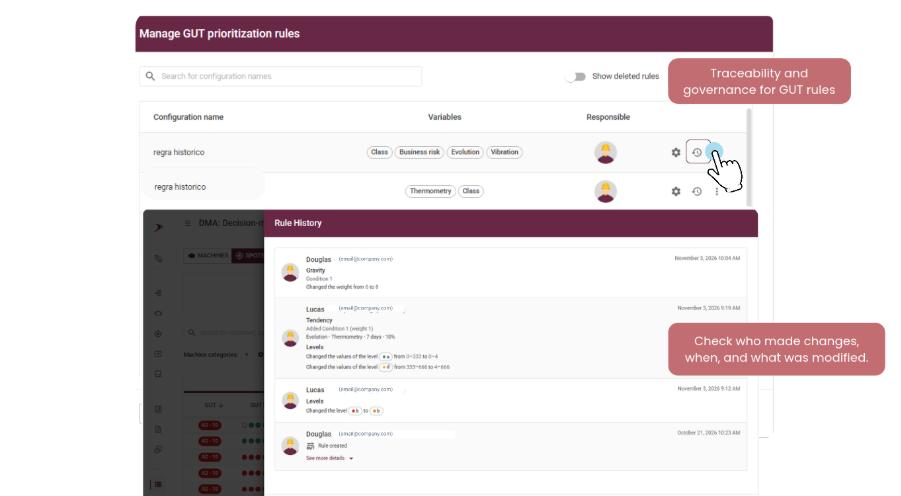
Logging starts when this release goes live, so earlier changes are not shown.
IMPROVEMENTS | More complete reports that are easier to fill in
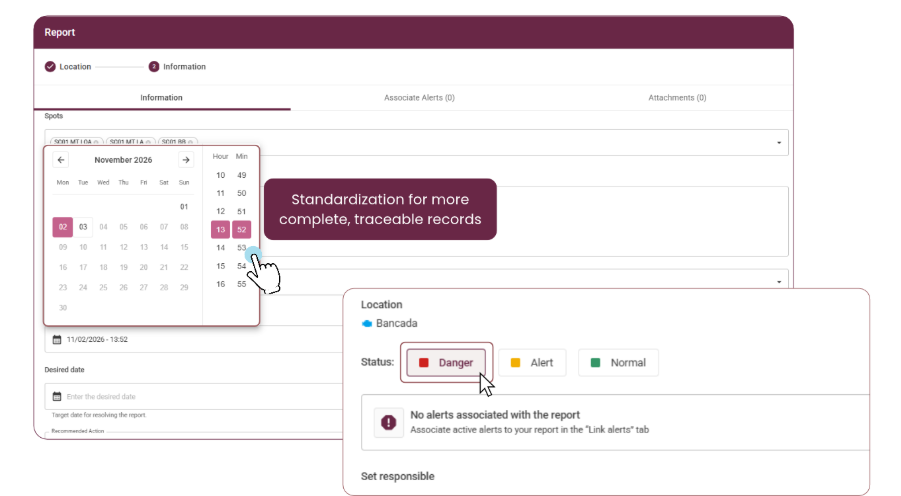
- Report events now record date and time, displayed as dd/mm/yyyy hh:mm in the user’s time zone, in the report view, list and export.
- The “Diagnosis” and “Observation” fields grow with the text.
- The red status “Imminent” is renamed “Danger” across the platform, including tables, filters, dashboard, PDF, exports and emails. Color, rules and severity stay the same.
In practice: a more traceable record of the sequence of events and less manual effort when filling in reports. Existing reports are not changed, and older dates without a time are still displayed normally.
These improvements were designed to make your monitoring more intuitive and efficient, contributing to a more agile and clear operation in your daily routine.