2.2) Asset Tree Creation

The first step in the process of initiating the deployment of Dynamox’s monitoring system is the creation of the company’s asset tree.

The Asset Tree is a visualization in the shape of a tree, with all the assets in which the system developed by Dynamox will be deployed. This functionality allows an overview of the organizational structure, facilitating the analysis and management of assets, through the hierarchy of units, sectors and machines of the company.

Through asset tree management you can create subworkspaces to reflect your company’s structure. To edit the tree, the user (with administrator permission) must access the “” option, in the upper right corner.
The gear symbol ““, which will appear next to the name of each level will allow you to edit or delete levels. To add sub-levels, the user must click on the “” icon, next to the desired entity.


Figure: Asset tree creation
 
By selecting the “ ” icon on a workspace, you can create a  subworkspace ” ” or a machine “
 

Figure: Sub-area configuration

By selecting the Create Subworkspace option, a new window will open, asking for information to create this subfolder. In addition, in the “users” tab, you can manage the users that will have access to this subfolder (for more information on user management, see the next section on user management). After saving, the subfolder will be created. 
 

Figure: Subworkspace configuration
 
When creating a machine, you must select the option in light blue. The following information will be requested:


Figure: New Machine Setup Tab
 
1) Information
 
  • Machine name (required): used to identify the machine.
  • Machine description (optional): information regarding function, position, shape, etc.
  • Address (optional): Location where the machine is installed. It’s possible to use geo-reference, via Google Maps.
  • Image (optional): it’s possible to register a picture of the machine.
  • Other information: manufacturer, machine model and other items can be optionally entered.

2) Characteristics

– Risk class (optional): Criticality of the machine (Business Risk, A, B, C, D)
– Type (optional): A choice list presents options with different asset types. Depending on the machine chosen, you will be asked for technical data regarding the referred asset model. Below, there is an example on how to fill in the information for a gearbox.


Figure: Filling in the characteristics of the monitored machine
 
3) Frequencies (optional)

Machine characteristic frequencies can be added in the “Frequencies” tab. Afterwards, the Spots created within that machine will inherit the frequencies created.

The process of inheriting the frequency from the in Spots is detailed in the section “Creating Spots”.

4) Users (optional)

It is possible to register users with machine-level subscriber permissions, so that they can receive notifications via e-mail if any configured alerts are triggered by one or more Spots.

Note: A user will not be able to access, edit or delete the machine to which he/she is subscribed unless he/she has the administrator or editor’s permission at a higher level than the one in the asset tree.

After filling in the requested information and selecting , the machine will be created.

From this created machine level, you can create other new levels using the “” icon next to the desired machine. These are: Subsets (and components), Spots and, for clients of the sensitive module, associate Checklists.
 

Picture: Options to create subset, component, Spot, and associate checklists
Subset: indicated for large machines with several Spots. It allows a grouping of Spots or checklists within sub-levels of the machine, thus creating a better organization of itself.

Component: in subsets it is possible to even create another level, the component one. These allow one to create Spots and associate checklists separately. The creation process is similar to the procedure for machines/subsets.

 Spot: these are the levels where the vibration and temperature sensors are associated. Within a machine it is possible to create as many Spots as necessary and in each one of them a history of vibration and temperature data will be generated.

Checklist: exclusive to customers of the sensitive module, allows the user to associate the sensitive inspection checklist templates with the referred machine.

Note: The functions described above are only available to users with Administrator permissions.


4) Spot Edition

After creating a Spot, it may be necessary to do some parameter editing.
In the case of Web Platform editing, there are different paths that lead to the same editing screen.

1) Through the “Spots” option in the Side Menu (image below):  this screen shows all the Spots already created within the Web Platform for the chosen workspace level.
At the top of the screen you can search for a specific Spot and access its editing screen through the gear icon highlighted in red on the picture.
 

Figure: Editing Spots via the side menu, “Spots” tab


2) Through the DMA Dashboard: in the row of each registered Spot, there is a gear symbol that allows access to the editing screen of the spot in question.


Figure: Editing Spots via the DMA Dashboard


3) From the Spot Viewer (data history) screen of each Spot: the option is available at the top of the screen “Edit Spot”.


Figure: Editing a Spot using the “Spot Viewer” screen


4) Through the Asset Tree: after accessing the “” mode, the user simply clicks on the gear symbol “” of the Spot that he wishes to edit.


Figure: Spot Editing via the Asset Tree.


The 4 options listed above will allow the same edits to be made to the Spots. These edits are essentially the same as those that were previously registered in the Spot setup, described in the previous  “Creating Spots” sections.


9.2) Vibration Spectrum Analysis

When accessing a spectrum in the Web Platform, first the spectral in the frequency domain is displayed for the active, accelerating axes. Information is also available for the velocity and displacement quantities (see Metrics section).


Figure: Spectral analysis and available tools


At the top of the page, information is displayed about which time period the viewed spectral refers to and which axes were collected. By clicking on the rectangle with the date, you can also browse spectra in nearby time periods for a quick visualization.


Figure: Spectral Analysis Selection


The following section explains each of the tools in the role upper toolbar:

Zoom Tools

Several functionalities are analogous to the zoom tool of the Spot Viewer, detailed in previous sections. On the other hand, the Spectral Analysis zoom tools have differentiating features, such as keyboard shortcuts, with the objective of boost the way the user relates to the Platform.
In addition, when zooming in on the graph a return zoom button appears, as it can be seen in the picture below, allowing the user to undo the last zoom command.


Figure: Zoom return button


Cursor Tools

It is possible to highlight specific frequencies, their harmonics and their sidebands on the graphs. To highlight a specific frequency, simply select the cursor type, place the mouse on the graph and mark. The points corresponding to the selected frequencies will be displayed on the graph, as well as a window with their amplitudes. The cursors are important to analyze, in detail, the frequencies that are being excited in the spectrum, as well as their sources.
The single cursor, as its name suggests, will mark a specific frequency in the spectrum. The harmonic cursor will mark multiples of the chosen frequency. Finally, the sidebands cursor will mark a central and side frequencies, as chosen by the user.


Figure: Cursor Tool
 
Similar to the Zoom tools, there are shortcuts for creating cursors quickly, which are also detailed in the Spectral graphs shortcuts section.
In the Waveform graph the periodic cursor type is available. Finally, to remove a cursor, simply double click on the text box that provides amplitude and frequency values at the highlighted points on the graph.
All cursors have a subtitle indicating the vibration values in each axis at the instant they are positioned. The values are displayed at the bottom of each graph.


Figure: Point-to-point values of the cursors at the bottom of the graph

Automatic Frequency Markers 

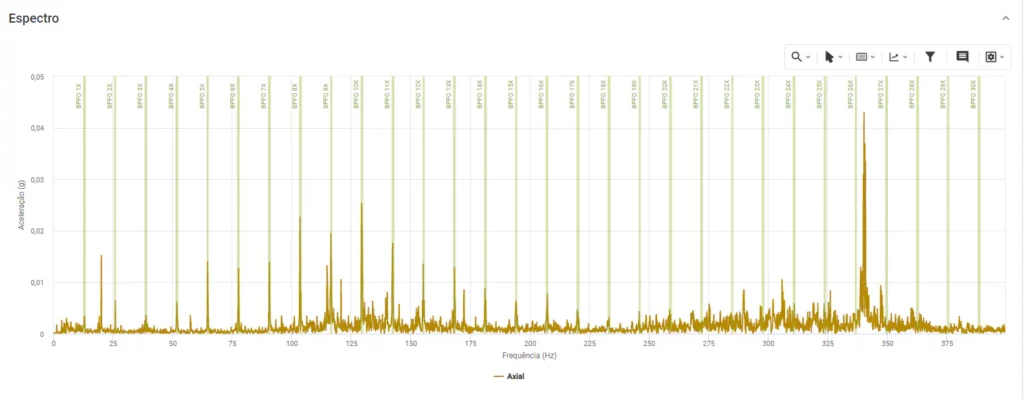
It is possible to highlight the rotational frequency of the machine, in addition to the characteristic failure frequencies of the bearing for cases where it has been registered in the bearing bank. The process of bearing inclusion is detailed in the Spot Creation section. The available options for automatic cursors on the Platform are:
  • RPM: Machine rotation frequency;
  • BPFI: Passing frequency of the rolling elements on the innner race;
  • BPFO: Passing frequency of the rolling elements on the outer race;
  • BSF: Rotation frequency of the rolling elements;
  • FTF: Rotation frequency of the cage.


Figure: Tools highlighting rotational frequencies and bearing failures

Customized Frequency Markers

This tool allows the insertion of frequency markers for visualization on spectral graphs. In this way, it will be possible to register the different frequencies present in the machines (blade pass frequency, gearing frequency, electrical failure characteristic frequencies, among others). The process of setting up a custom marker is detailed in the Spot Creation section, on the “Frequencies” tab.
 

Figure: Customized Frequency Markers 

When analyzing a spectral, the marker will be available next to the other tools, via the wave symbol.


Figure: Accessing the custom marker tool
 
When the marker is activated, indicative lines will appear on the spectrum, as previously configured (color pattern, value on axis, origin).
 

Figure: Cursor tool with customized frequency values
 
This tool helps the user to visually identify the frequency of interest and its harmonics, aiming to identify patterns to detect known failure modes.

Metrics

Allows you to change the spectral magnitude (acceleration, velocity, or displacement) and their respective units. It can be accessed through the toolbar above the spectral graphs shown.


Filter Tools

It is possible to apply filters that help eliminate noise and highlight characteristics of the signal. When you select the option, a new window will open where you can choose the desired filter type and cutoff frequencies.


Figure: Accessing the filter tool

The options are: ‘High Pass’, ‘Low Pass’, ‘Band-Pass’, ‘Center Frequency’ filters.
The objective of the DMA Dashboard is to support maintenance decision making and interventions by providing an overview of the Spots condition, based on previous measurements and user-defined alarms (A1 and A2).
 

Figure: Filters tool

The shortcut for using filters on graphics is ( Shift + F ).

Notes 

It is possible to add notes to custom frequencies. The annotations serve to assist the analyst in viewing the spectral analysis graph more clearly and objectively.


Picture: Accessing the note tool


When you select the icon in the top toolbar of the spectral analysis graphs, a window will appear asking for two fields of information: at what frequency the user wants to insert the note, and a subtitle box that will appear over the cursor on the graph.


Figure: Add notes on specific frequency


The keyboard shortcut for using the notes on the graph is ( Shift + N ).

Visualization Options

The series of visualization options, which can be accessed from the top right menu, encompasses a number of functionalities, including: plotting grid lines, viewing the graph in logarithmic scale, which can fault defect detection on slow rotating machines, or displaying the text boxes of cursors added via the “Cursor tooltip” option.


Figure: Visualization Options

Spectral Chart Shortcuts

Aiming at the dynamic use of the Platform, the Spectral Charts have several shortcuts that encompass the main tools for analyzing vibration spectra. The shortcuts are arranged as shown in the table.


Figure: Spectral chart shortcuts


1.1) Home Screen and Main Menu

Immediately after logging in, at the top of all screens you will be able to view/hide the side menu, as well as the print commands, help, and language.


Picture: Available Options in all screens.
 

Currently, the Web Platform is available in Portuguese, English, Spanish, French and Korean.

When logging in, the first screen to be shown is the DMA Dashboard , which will be discussed in detail in the following sections.


Picture: Platform Home Screen – DMA Dashboard
 
The side menu, shown in the picture above, can be accessed at any time after the user login. 
 

Picture: Side Menu
 
From there, you can access the Integrated, Predictive, and Sensitive sections (available to customers who have purchased this module).

Integrated

In the Integrated section, an overview of the data and assets that composes the workspace is presented, through the functions:

1. Dashboard: section that centralizes data obtained from predictive and sensitive data. It is divided into two parts:
 

Figure: Integrated section in the side menu
 
  • Health Indicators: presents the health of the assets by sectors, taking into account the predictive and sensitive modules (in case the company has acquired it).
  • Reports: presents all the predictive and sensitive analyses performed by users in the client company.

2. Asset tree: enables the hierarchy of the company’s units, sectors and machines, facilitating the organization and management of the available assets.

3. Machines: presents a view per machine, considering the predictive and sensitive module. By selecting a machine to visualize, it presents a grouped view of all Spots located on this specific machine, as well as anomalies detected by sensitive inspectors through the sensitive module.

Predictive

The Predictive section presents the main functions that support predictive monitoring, based on information from Dynamox’s vibration and temperature sensors, the DynaLoggers. Among them are:
  • DMA Dashboard: decision support panel, which displays an indication of the assets’ health, through the information of the sensed Spots and alarms configured for each point.
  • Spectral Analysis: list with all the spectral analyses performed by Spot and machine.
  • Spots: list with all the monitoring points (Spots) created, their respective machines and DynaLoggers.
  • Gateways: lists all registered Gateways (automated data collectors for Dynamox sensors) and their respective settings.

Sensitive (Optional)

In the Sensitive section, functions that support the creation and management of sensitive inspection routes are available:

  • Dashboard: six dashboards are available to assist decision making, regarding sensitive inspection routes and anomalies reported by field inspectors.
  • Adherence Groups: a panel that provide the list with the grouped user groups for route adherence accounting.
  • Route Management: a list with all the inspection routes and their respective information, as well as the option to create and manage new or existing routes.
  • Checklist Models: a list of all checklists created, and option to create new checklist templates.

More information regarding the use of these features is described in the Sensitive Inspection Manual.


5) App: Synchronization

Once the data has been collected  from the app, we recommend that users synchronize the data. This way, the data will be uploaded to the Web Platform and will be added to the historic data for the respective spot.

Synchronization is performed via the Synchronization option from the side menu, or via the red  notification bar “Synchronization Required”.


3.3) Vibration spectra

Spectral Analysis

The “Spectral” tab, allows the user to request a spectral analysis from the DynaLogger. This analysis can be performed on a specific axis or on all three axes simultaneously, by simply pressing the icon (+).

The user will be asked to select the axis (X, Y, Z or all) on which to perform the spectral analysis. On the HF and AS devices, the user will also be asked for the duration and maximum frequency of the spectral analysis.

After the spectral analysis, two graphs will be displayed: one with accumulated time and the other with the frequency spectrum. In addition to acceleration graphs, it is also possible to view velocity graphs.
To do this, simply touch the selection button (above the charts) and select the desired graphic. It is also possible to show or hide the axes to be viewed and access details of the spectral analysis.

By synchronizating the app, the data will be sent to the Web Platform, where the user can analyze the data in more detail.


2.3) Associate a DynaLogger with a spot

On the screen for registering a new spot, after choosing the model of the DynaLogger and assigning an identification of the monitoring point, the DynaLogger should be associated to the spot in question. To do this, press the + icon located next to the message “No DynaLogger selected”.


A screen will appear showing DynaLoggers within the Bluetooth range of the device. 

Once the desired DynaLogger has been selected, the following parameters must be set in order to complete the spot settings.

• Sample interval: the value that defines the frequency of data collection, i.e. time delay between measurements.

• Sensors for monitoring: defines which parameters will be collected by the associated DynaLogger.

• Default Spectral: defines the duration and maximum frequency characteristics of the standard spectral analysis. This information is important for spots that will be collected by the Dynamox Gateway (automatic collection). 

• Monitoring Location and RPM: type of component to which the DynaLogger is attached and the revolutions per minute of the rotating component;

• Range: Range of acceleration/velocity, that is, the maximum values that the DynaLogger will be able to collect. This choice impacts the graphics resolution.

• TH: defines the trigger point for asynchronous measurements in [g], i.e. the value to which, if exceeded, the DynaLogger will “wake up” and collect global vibration and temperature data. The value must be between 0 and the maximum range value.
*Available for DynaLogger AS only.

• Alerts: thresholds for which an LED alert will be triggered in case of transgression. There are two levels: A1 and A2, with A2 being the most critical. The Dynalogger LED flashes green every 5 seconds. If A1 is transgressed, the color becomes red. In case the same happens to A2, the alert remains red, but blinks twice in a row. These limits can be configured for temperature, velocity and, for devices that are supported, acceleration.

• Axes: Positioning configuration of the installed DynaLogger. By clicking on the question mark, an image will be displayed showing the DynaLogger X, Y and Z axes orientation. This orientation is also displayed on the device label. Based on this, the user can select the actual positioning given to the DynaLogger on the machine for each of the three axes. If you have any doubts about this subject, please refer to the section for Positioning of the sensor.

Once the spot settings have been completed, the changes can be saved by clicking “SAVE” located in the top right-hand corner. A summary of the settings will then be shown for confirmation.


2.2) App: Register a new spot

By selecting a specific machine, the Spot list associated with that machine is displayed. The names of the spots, serial numbers of the associated DynaLoggers and the dates of the latest collection are shown.


If no spots have been registered yet, the message “No spots added. Click on + to add Spots to your Machine” will appear. By pressing the icon (+) in the bottom right-hand corner of the screen, new spots can be created.

By pressing the icon (+), the registration form for a new spot is displayed. On this screen it is possible to associate and configure all of the monitoring parameters of the DynaLogger.


First, choose the DynaLogger model to be registered (TcA, AS or HF) and then add the identification of the monitoring point.

The other fields are explained in more detail in the next section.