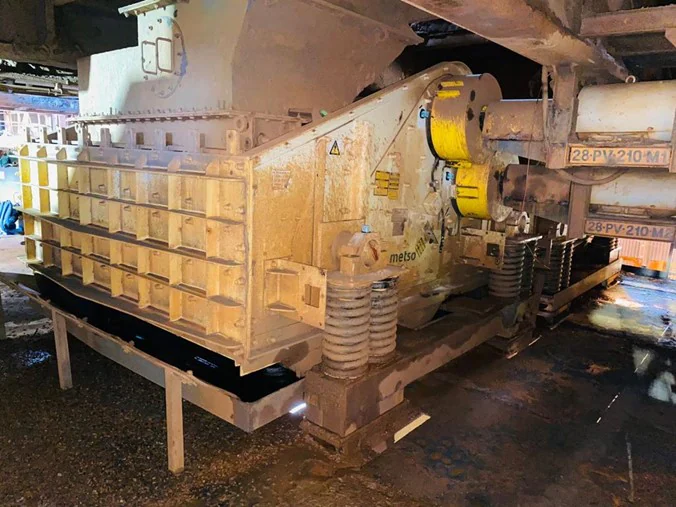
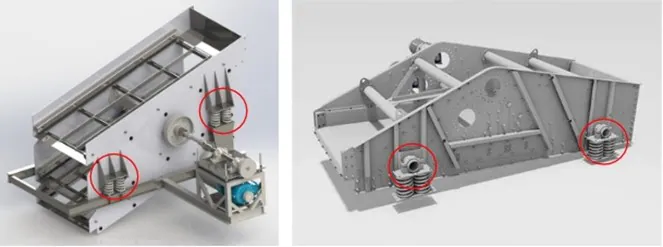
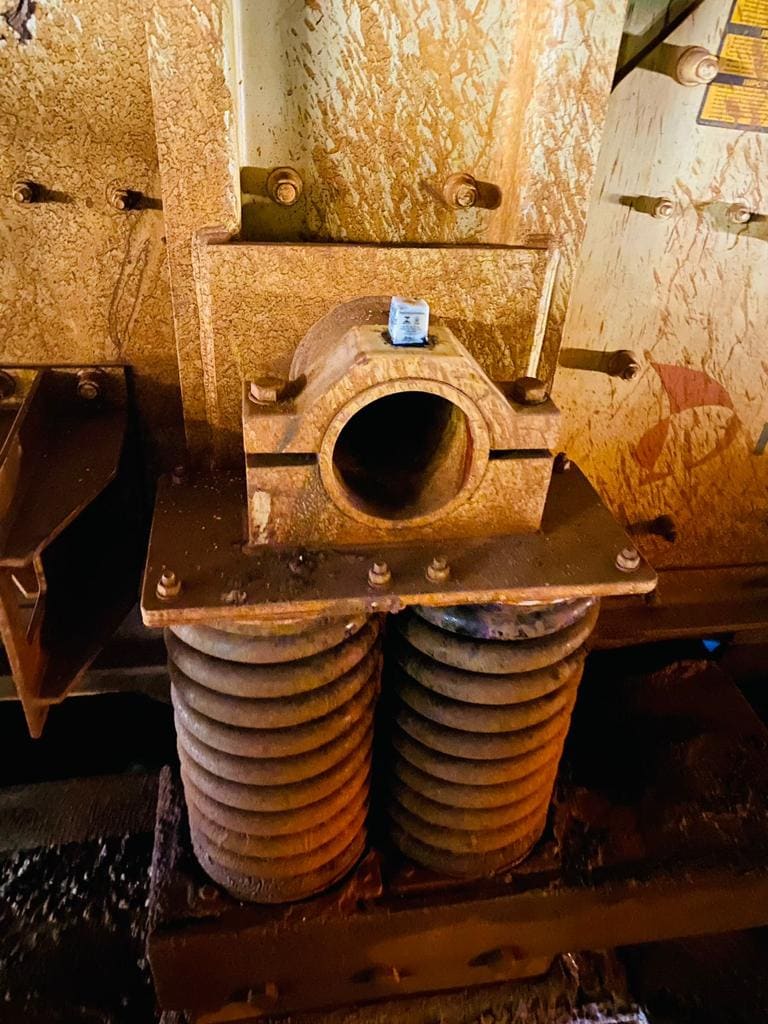
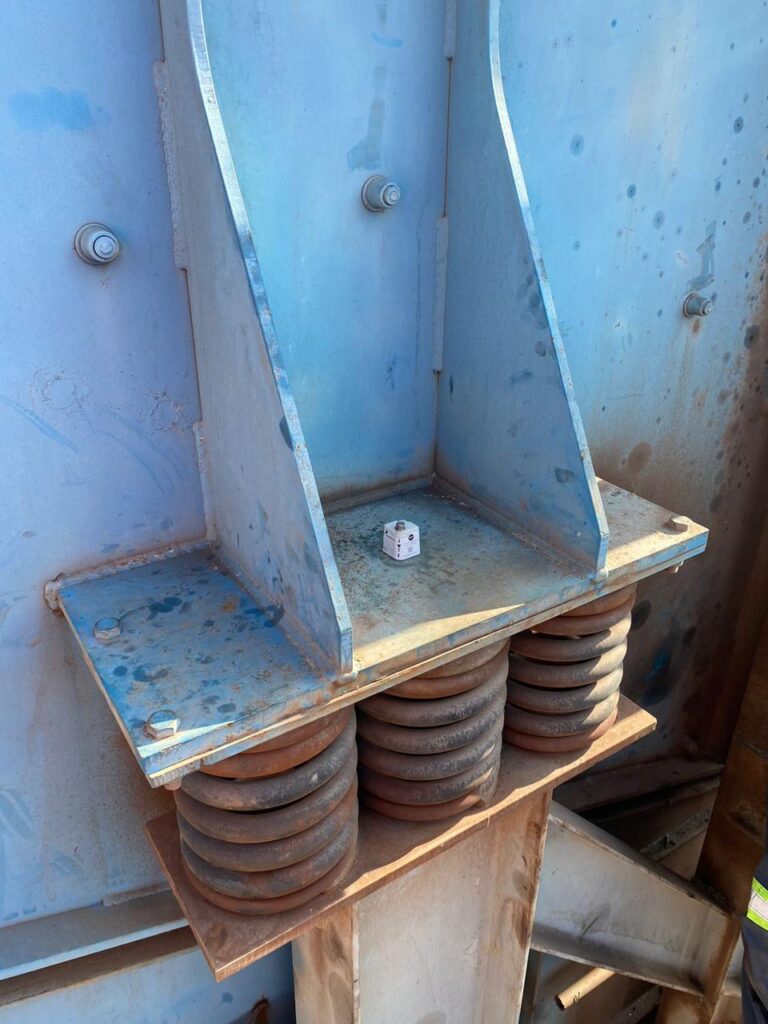
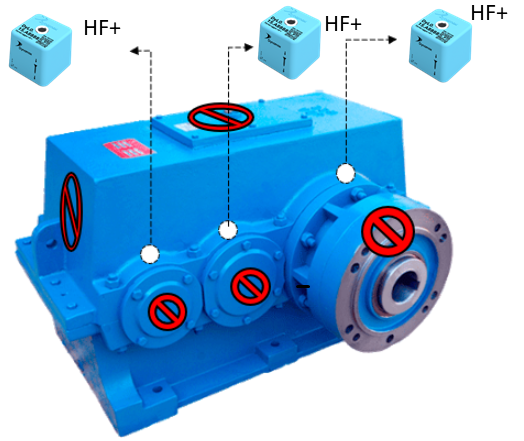
Mounting
The mounting method is one of the most critical factors for measuring vibration. A rigid attachment is essential for avoiding false readings and data.
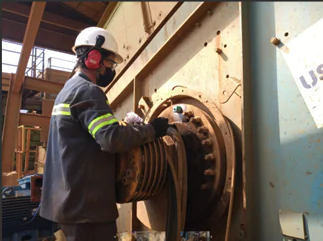
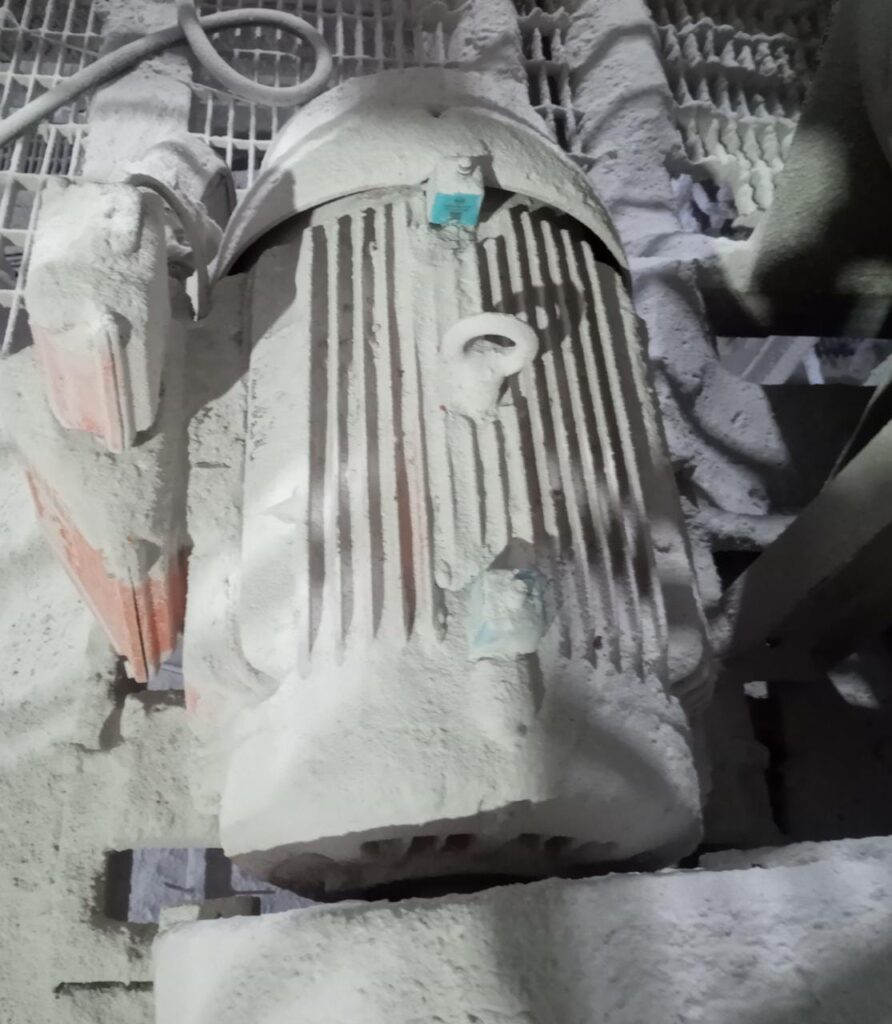
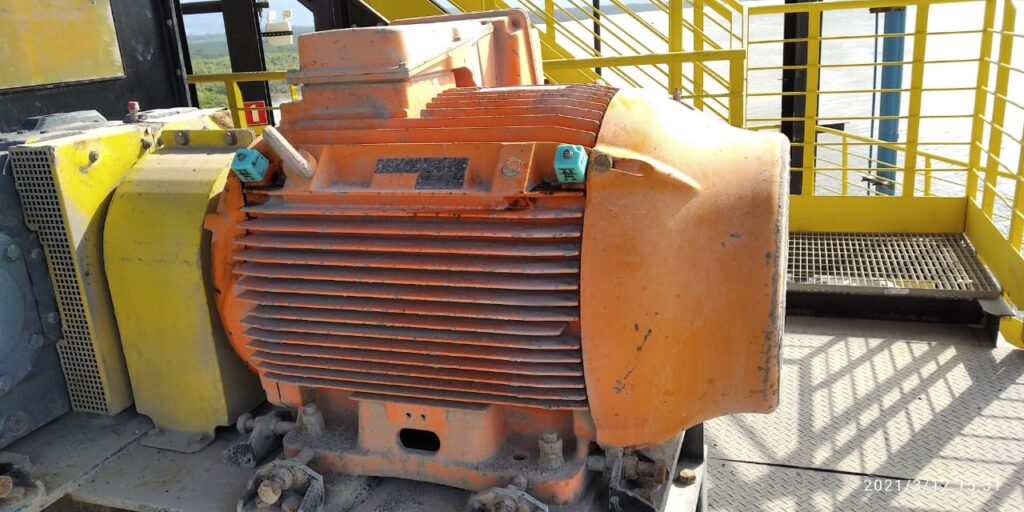
Depending on the type of machine and position, different mounting methods could be used. To get the best results from the DynaPredict solution, screw mounting is recommended. To do this, the installation surface must be prepared first, as described below.
Screw Mounting
Before choosing this mounting method, check that the installation point on the equipment is thick enough for drilling. If so, follow the step-by-step procedure below
Drilling the Machine
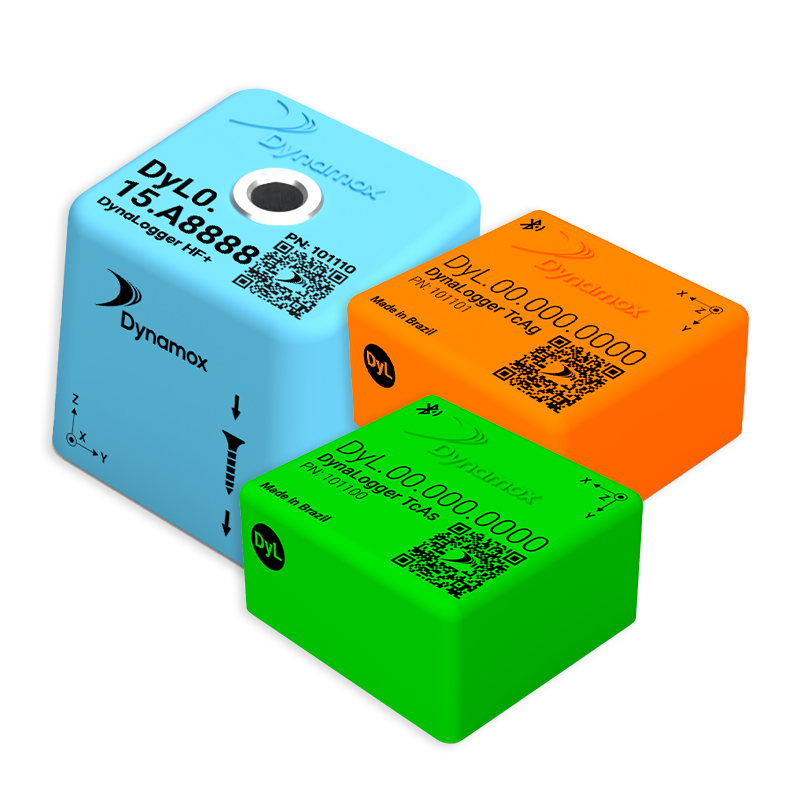
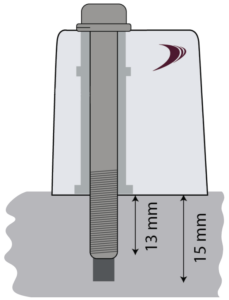
Drill a threaded hole with an M6x1 threaded tap (supplied in kits with 21 DynaLoggers) at the point of measurement, at least 15mm deep.
Cleaning
Using a wire brush or fine sandpaper, clean any solid particles and scale on the surface of the measurement point.
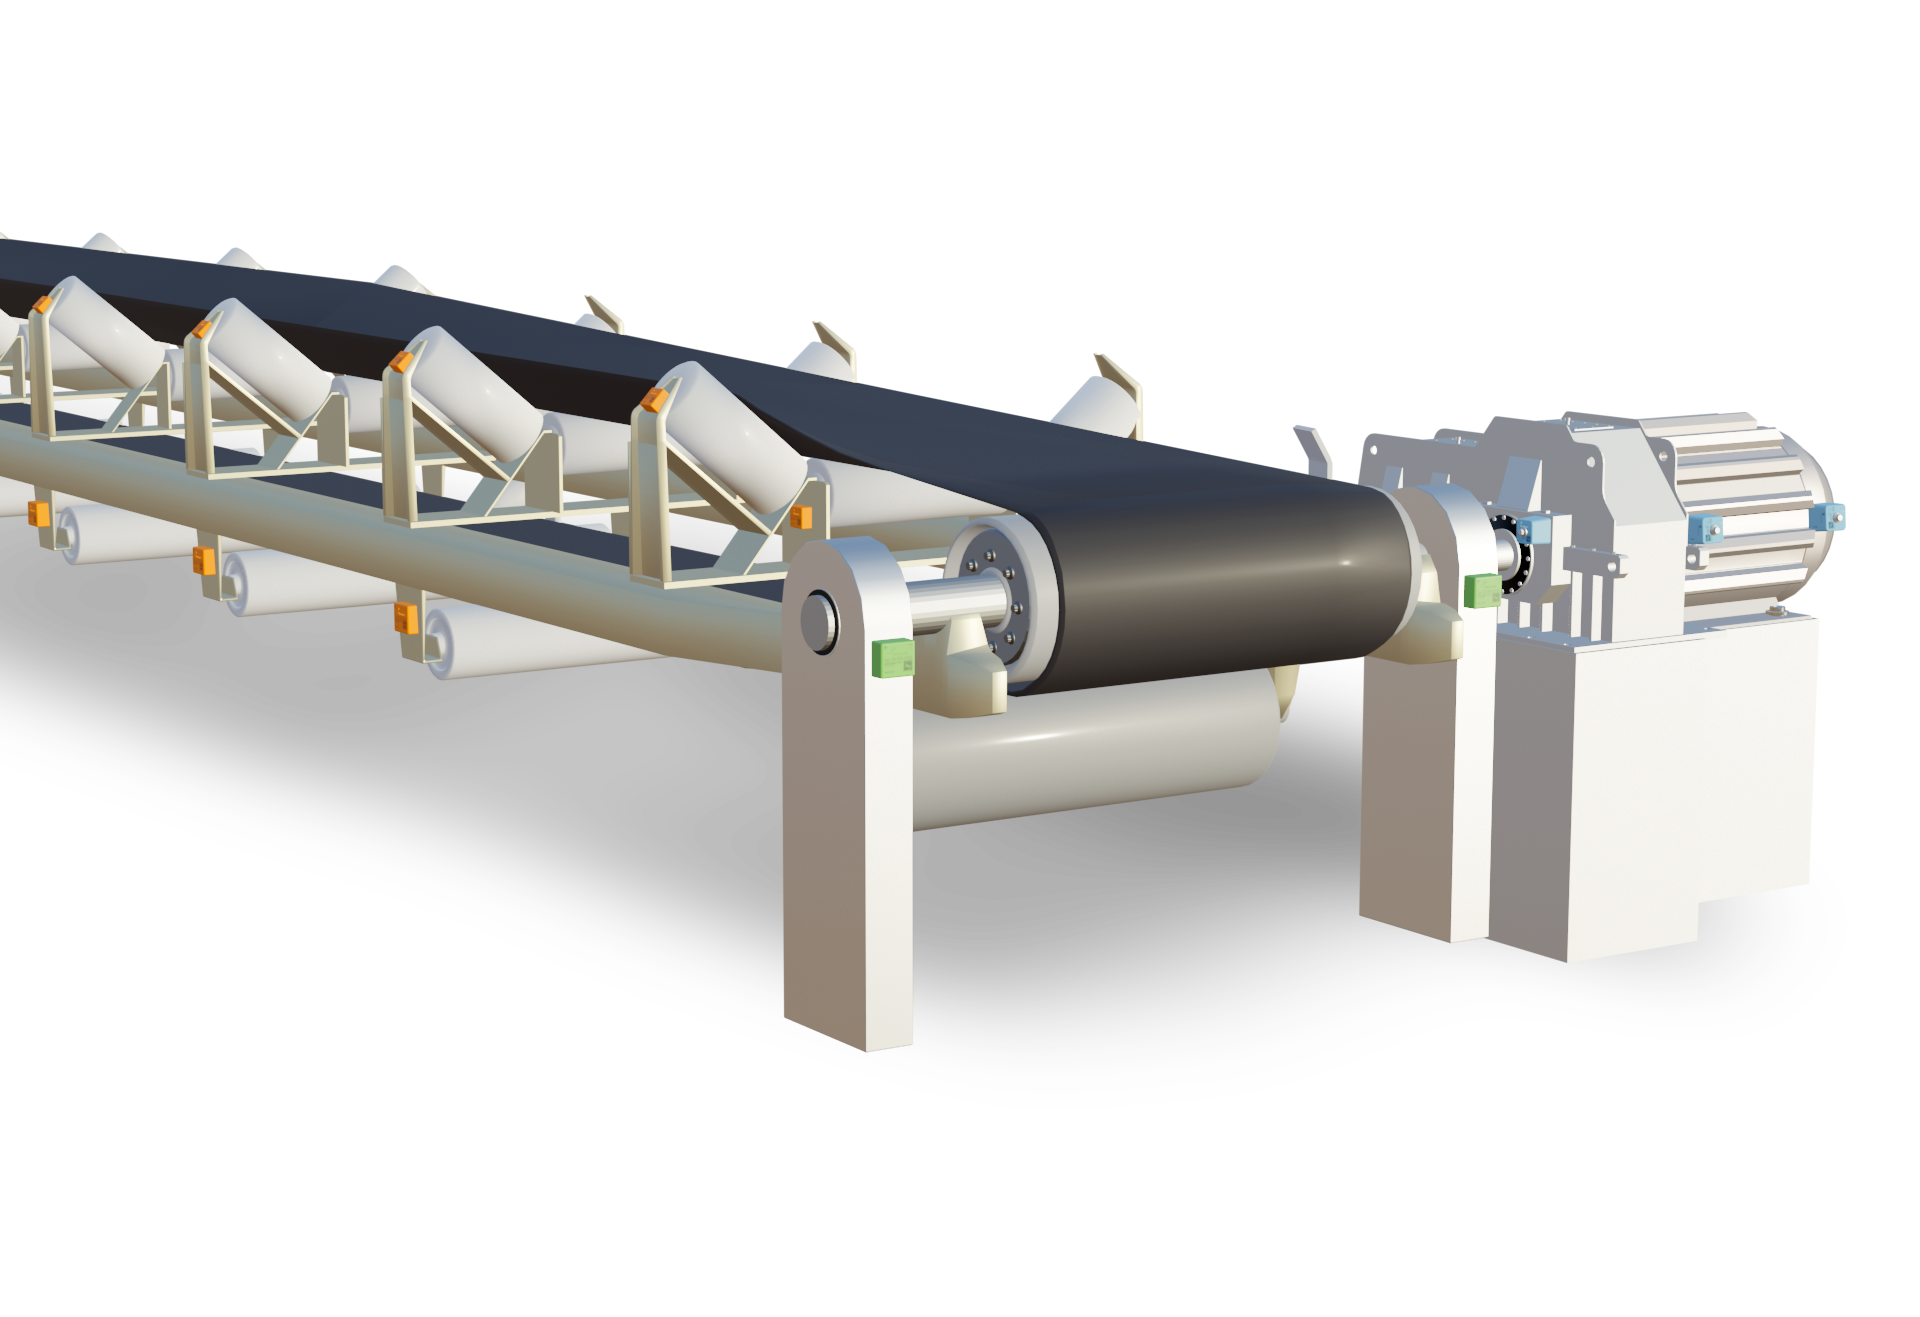
After surface preparation, the DynaLogger attachment process should begin.
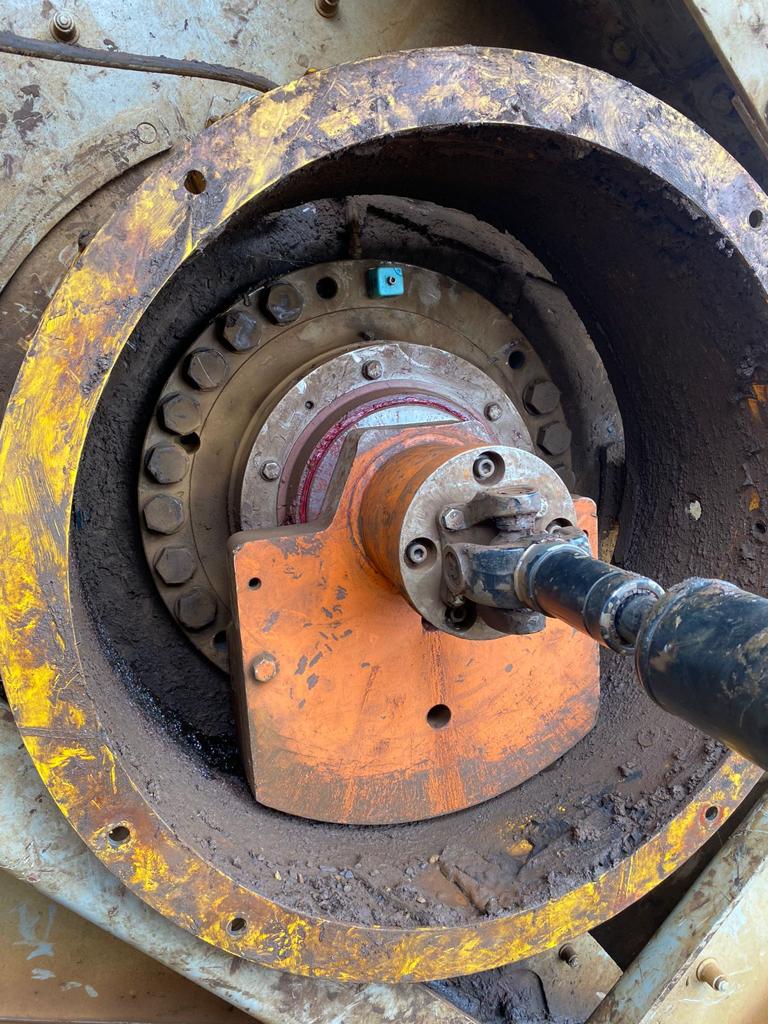
DynaLogger attachment
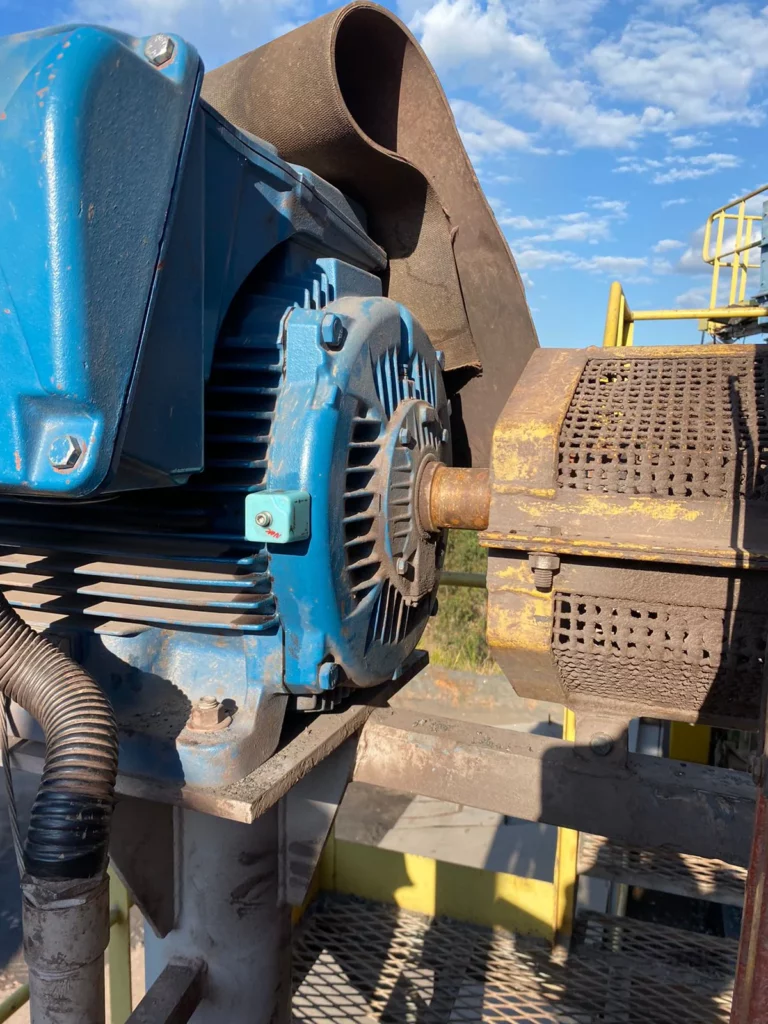
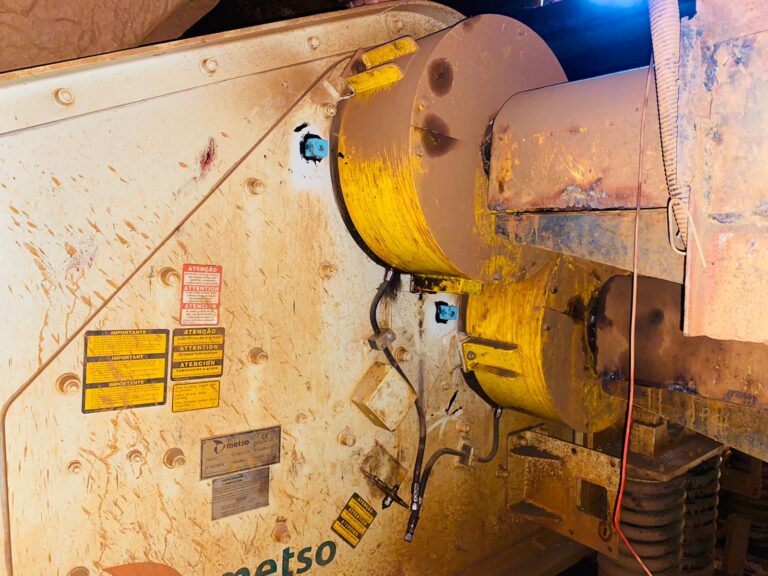
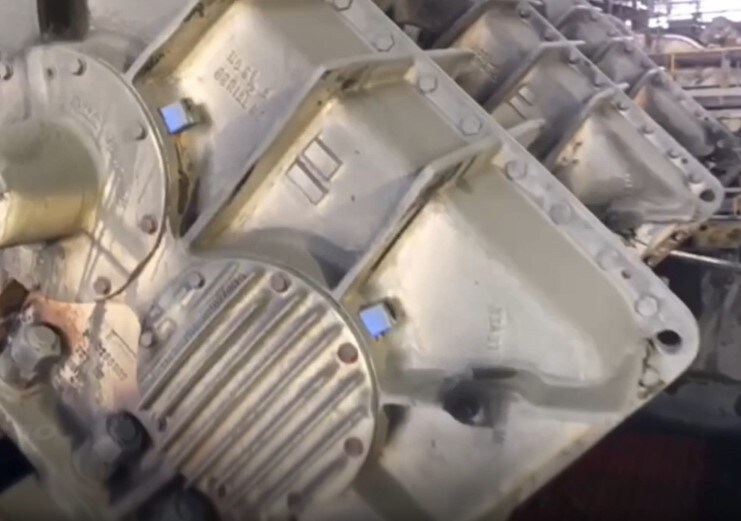
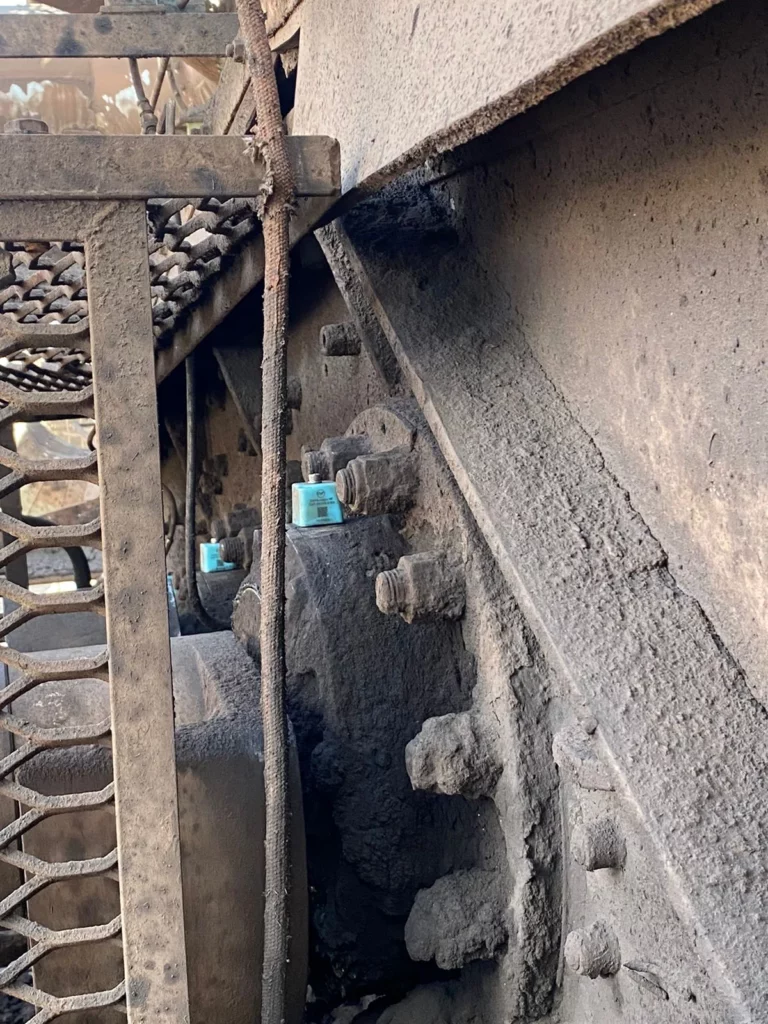
Position the DynaLogger at the measurement point so that the base of the device is completely supported by the installation surface. Once this is done, tighten the screw and spring washer* supplied with the product, applying a tightening torque of 11Nm.
* Use of the spring washer is critical to achieving reliable results.
Adhesive Mounting
Preparation of the Adhesive
The most suitable adhesives for this type of fixation, according to tests conducted by Dynamox, are the Scotch Weld DP-8810 or DP-8405 structural adhesives from 3M. Follow the preparation instructions described in the manual of the adhesive itself.
Dynalogger Attachment
Apply the glue so that it covers the DynaLogger’s entire bottom surface, completely filling the center hole. Apply the glue from the middle to the edges.
DynaLogger installation with glue fixation
Press the DynaLogger on the measuring point, orienting the axes (drawn on the product label) in the most appropriate way.
Wait for the curing time indicated in the manual of the glue manufacturer itself, in order to guarantee the good fixation of the DynaLogger.