WEB: September/2023
Software: DynaPredict Web Platform
New Version: 3.22.0
Here are the release notes for version 3.22.0 of the DynaPredict Web Platform, with the new features listed:
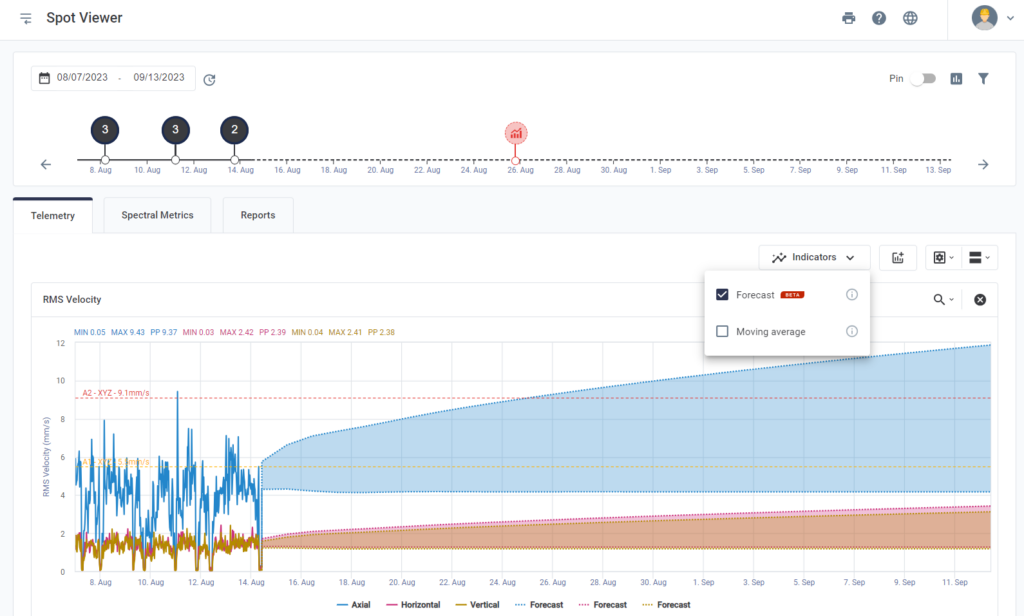
1) A2 forecast now appears as an event in your timeline
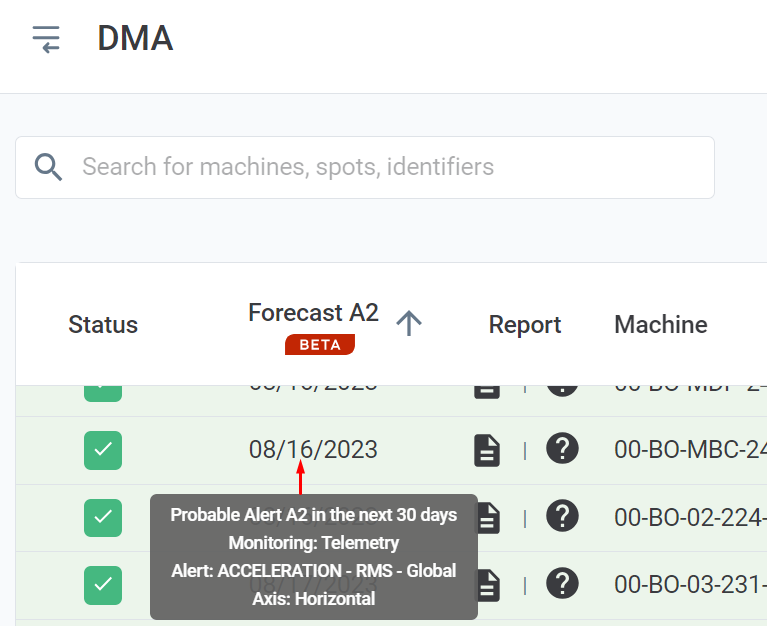
With this update, if the asset is expected to trigger an A2 alert within the next 30 days, the information will appear as an event on your timeline, making it easier to visualize and identify the forecast.

By the way…
Are you already using the DynaPredict Web Platform forecasting tool?
It is a tool that allows users to manage maintenance actions for their assets in advance. With the forecast, you can view projections of telemetry graphs and spectral metrics and check the DMA to see if any future A2 alerts are expected, as in the image below. This ensures greater assertiveness and reduces the time the analyst needs to spend looking for points with a critical trend for analysis.

2) Spectral logarithmic scale
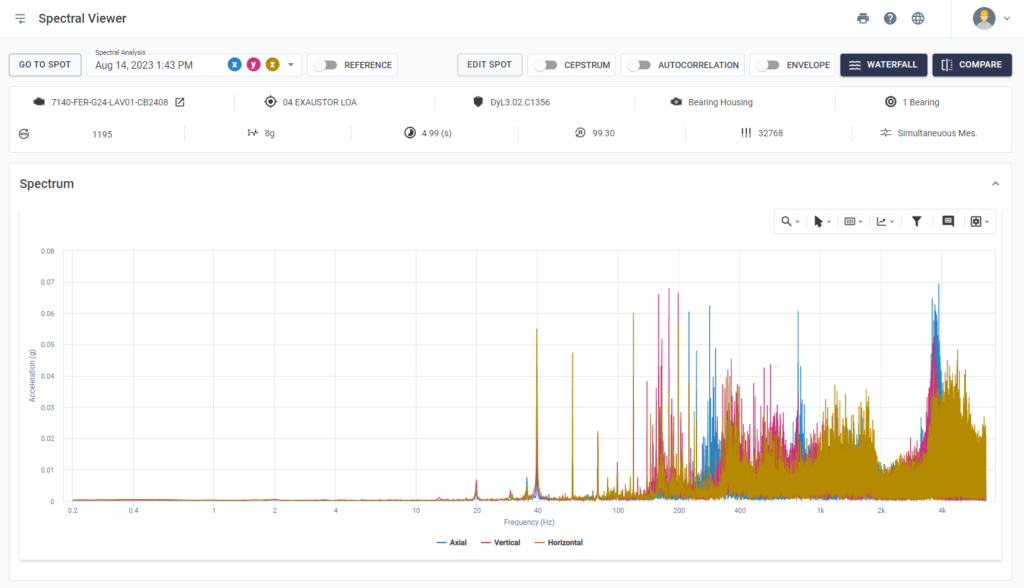
Logarithmic representation is an alternative way of visualizing spectra. It is mainly applicable in cases where very different magnitude values are expected to be displayed on the same graph. This tool will help you detect failures in two ways:
– Log X scale will help in spectra analysis, allowing low and high frequencies to be visualized together.

– Log Y scale will mainly help in the analysis of spectra that have peaks of great magnitude and elevations of the spectral carpet, which often remain unnoticed because of these peaks, but which can be analyzed together with the log Y visualization.
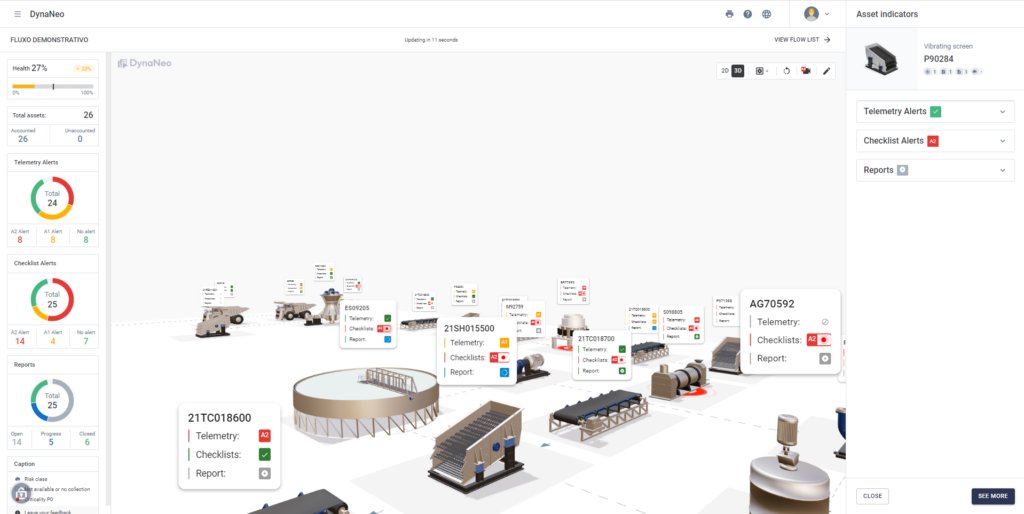
- 3D DynaNeo
Now, the DynaPredict Web Platform offers a 3D version of the DynaNeo tool. In other words, you can create much more intuitive dashboards, obtaining an immersive experience when viewing the assets installed in your plant. This makes it easier to identify alerts and speeds up the mapping and decision-making process.
