1) Platform Access

The access to the Web Platform is performed through the URL: https://dyp.dynamox.solutions.

Initially, the login screen will be displayed and the user must enter their access credentials to enter the Platform.

If you do not have access credentials, you can contact Dynamox directly, through the e-mail support@dynamox.net. If the user forgets his/her password, it is possible to reset it through the option “Forgot your password?” generating a link that will be sent to the registered e-mail.


Picture: User Authentication
 

After logging into the Web Platform, you must choose the workspace you want to access, based on the permissions assigned to the user.


Picture: Workspace Selection

 
After selecting the workspace, the user will have access to the Web Platform and all its functionalities.


1.1) Home Screen and Main Menu

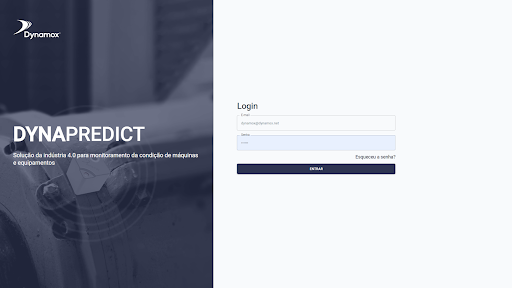
Immediately after logging in, at the top of all screens you will be able to view/hide the side menu, as well as the print commands, help, and language.


Picture: Available Options in all screens.
 

Currently, the Web Platform is available in Portuguese, English, Spanish, French and Korean.

When logging in, the first screen to be shown is the DMA Dashboard , which will be discussed in detail in the following sections.


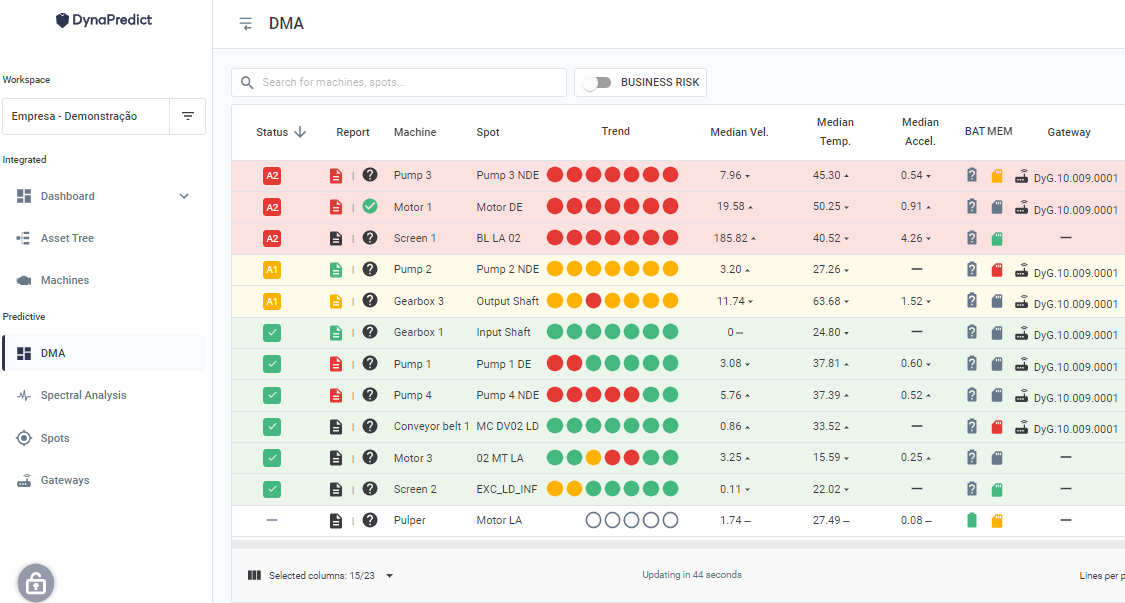
Picture: Platform Home Screen – DMA Dashboard
 
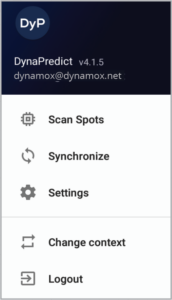
The side menu, shown in the picture above, can be accessed at any time after the user login. 
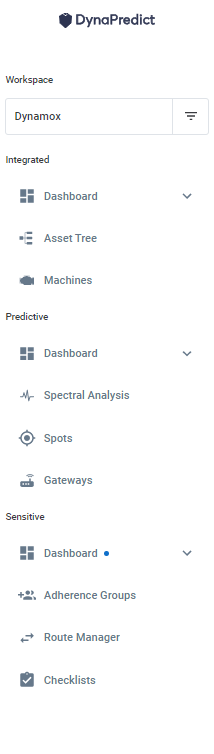
 

Picture: Side Menu
 
From there, you can access the Integrated, Predictive, and Sensitive sections (available to customers who have purchased this module).

Integrated

In the Integrated section, an overview of the data and assets that composes the workspace is presented, through the functions:

1. Dashboard: section that centralizes data obtained from predictive and sensitive data. It is divided into two parts:
 

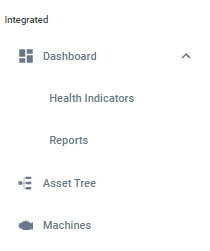
Figure: Integrated section in the side menu
 
  • Health Indicators: presents the health of the assets by sectors, taking into account the predictive and sensitive modules (in case the company has acquired it).
  • Reports: presents all the predictive and sensitive analyses performed by users in the client company.

2. Asset tree: enables the hierarchy of the company’s units, sectors and machines, facilitating the organization and management of the available assets.

3. Machines: presents a view per machine, considering the predictive and sensitive module. By selecting a machine to visualize, it presents a grouped view of all Spots located on this specific machine, as well as anomalies detected by sensitive inspectors through the sensitive module.

Predictive

The Predictive section presents the main functions that support predictive monitoring, based on information from Dynamox’s vibration and temperature sensors, the DynaLoggers. Among them are:
  • DMA Dashboard: decision support panel, which displays an indication of the assets’ health, through the information of the sensed Spots and alarms configured for each point.
  • Spectral Analysis: list with all the spectral analyses performed by Spot and machine.
  • Spots: list with all the monitoring points (Spots) created, their respective machines and DynaLoggers.
  • Gateways: lists all registered Gateways (automated data collectors for Dynamox sensors) and their respective settings.

Sensitive (Optional)

In the Sensitive section, functions that support the creation and management of sensitive inspection routes are available:

  • Dashboard: six dashboards are available to assist decision making, regarding sensitive inspection routes and anomalies reported by field inspectors.
  • Adherence Groups: a panel that provide the list with the grouped user groups for route adherence accounting.
  • Route Management: a list with all the inspection routes and their respective information, as well as the option to create and manage new or existing routes.
  • Checklist Models: a list of all checklists created, and option to create new checklist templates.

More information regarding the use of these features is described in the Sensitive Inspection Manual.


7) Associate a DynaLogger to a spot created on the Web Platform

When a spot is created on the Web Platform, it will have an ‘inactive’ status because it doesn’t have a DynaLogger (sensor) associated to it.

The only way associate a DynaLogger is via the app. 

When accessing the app, the spot will appear in the machine with the ‘Inactive’ status. A DynaLogger can be associated by pressing the edit icon (pencil) and following the instructions detailed in 2.3) App: Associate a DynaLogger with a spot. 


Note: it is necessary to synchronize the app  for the machines and spots created on the Web Platform to be available to the app user. The synchronization can be done via the side menu of the app.

6) Replacing a DynaLogger without losing historical data

In case you need to replace a DynaLogger (i.e. swap a sensor within a spot), it can be done without losing the historical data of the spot. To do this, the user needs to have ‘Editor’ or ‘Administrator’ permission. The procedure is carried out via the app. 

On the home screen, search for the spot that contains the DynaLogger to be replaced. By touching the pencil icon on the right side of the spot, the edit spot screen will be opened.

On the edit spot screen, in the ‘Dynalogger’ section, touching the refresh button will initiate a scan for DynaLoggers within Bluetooth range of the device. 

The serial number of the replacement DynaLogger should be selected from the list. Having done this, just touch the “Save” button at the top of the screen.

This way you are guaranteeing that the data from the old and new sensor will be stored in the same spot.

Note: care should be taken to maintain the same position of the new sensor. In other words, position in the same place and with the same orientation of the axes.

Note 2: Don’t forget to synchronize the data from the app to be able to see the changes on the Web Platform.


5) App: Synchronization

Once the data has been collected  from the app, we recommend that users synchronize the data. This way, the data will be uploaded to the Web Platform and will be added to the historic data for the respective spot.

Synchronization is performed via the Synchronization option from the side menu, or via the red  notification bar “Synchronization Required”.


4) Settings

The application settings can be accessed via the side menu of the app. On this screen, the following settings can be changed:

• Wipe application data: erases all data from the app and removes all permissions.

• Enable query mode: Changes the DynaLogger memory cleaning function. By default, whenever data is collected from the DynaLogger, it is reset for storage of new data collection. By enabling query mode, whenever a collection is performed the user will be asked to decide whether or not to clear the DynaLogger’s memory.

• Default axis nomenclature: defines the default orientation of the X, Y and Z axes of the DynaLogger.

• Synchronization warning: Enables the notification bar for pending synchronization (red);

• Pending warning: Enables the notification bar for spots with pending status;

• Scan spots: Enables automatic searching for associated spots when opening a machine.


3.3) Vibration spectra

Spectral Analysis

The “Spectral” tab, allows the user to request a spectral analysis from the DynaLogger. This analysis can be performed on a specific axis or on all three axes simultaneously, by simply pressing the icon (+).

The user will be asked to select the axis (X, Y, Z or all) on which to perform the spectral analysis. On the HF and AS devices, the user will also be asked for the duration and maximum frequency of the spectral analysis.

After the spectral analysis, two graphs will be displayed: one with accumulated time and the other with the frequency spectrum. In addition to acceleration graphs, it is also possible to view velocity graphs.
To do this, simply touch the selection button (above the charts) and select the desired graphic. It is also possible to show or hide the axes to be viewed and access details of the spectral analysis.

By synchronizating the app, the data will be sent to the Web Platform, where the user can analyze the data in more detail.


3.2) Temperature, Velocity and Acceleration

After accessing the Snapshot screen, it is possible to view the graphs of the latest data collection, i.e. the data from the DynaLogger’s internal memory that has just been collected by the app. It is possible to view the graphs with the latest temperature, RMS velocity and RMS acceleration data (when available) collected by the DynaLogger since the last collection.

It is important to emphasize that the data collection of the DynaLogger erases* data from the device’s memory so that the device continually collects data normally.


*Exception: Users with a reader profile can view/read data on a smartphone screen, but this operation does not clear the DynaLogger’s memory. More information on permission levels can be found in the Web Platform Manual.

3.1) Data collection and instantaneous readings

By selecting a specific machine on the home screen of the app, the list of spots associated to that machine will be displayed. When selecting a spot from the Spot List, the app will attempt to connect to the associated DynaLogger, downloading the data from the device’s internal memory if it is within Bluetooth range (60m in open field).

If no machine or spot appears, visit the sections for creating machines and/or spots.


Snapshots – Instant Reading

The first screen the user will have access to is the “Instant Reading” where temperature and vibration values are shown in the 3 axes in real time. The default fill of these graphs is blue. However, for parameters with thresholds defined in the spot configurations, the color of the graph will change if the limits are exceeded. If no limit is exceeded, the graph color is green. If the A1 limit is exceeded, the graph color will change to yellow. If the A2 limit is exceeded, the color will change to red.

There is also information about the battery life, alert level and available memory on the device. Additional information can also be accessed from the associated DynaLogger, such as serial number, sample interval, and more.

2.3) Associate a DynaLogger with a spot

On the screen for registering a new spot, after choosing the model of the DynaLogger and assigning an identification of the monitoring point, the DynaLogger should be associated to the spot in question. To do this, press the + icon located next to the message “No DynaLogger selected”.


A screen will appear showing DynaLoggers within the Bluetooth range of the device. 

Once the desired DynaLogger has been selected, the following parameters must be set in order to complete the spot settings.

• Sample interval: the value that defines the frequency of data collection, i.e. time delay between measurements.

• Sensors for monitoring: defines which parameters will be collected by the associated DynaLogger.

• Default Spectral: defines the duration and maximum frequency characteristics of the standard spectral analysis. This information is important for spots that will be collected by the Dynamox Gateway (automatic collection). 

• Monitoring Location and RPM: type of component to which the DynaLogger is attached and the revolutions per minute of the rotating component;

• Range: Range of acceleration/velocity, that is, the maximum values that the DynaLogger will be able to collect. This choice impacts the graphics resolution.

• TH: defines the trigger point for asynchronous measurements in [g], i.e. the value to which, if exceeded, the DynaLogger will “wake up” and collect global vibration and temperature data. The value must be between 0 and the maximum range value.
*Available for DynaLogger AS only.

• Alerts: thresholds for which an LED alert will be triggered in case of transgression. There are two levels: A1 and A2, with A2 being the most critical. The Dynalogger LED flashes green every 5 seconds. If A1 is transgressed, the color becomes red. In case the same happens to A2, the alert remains red, but blinks twice in a row. These limits can be configured for temperature, velocity and, for devices that are supported, acceleration.

• Axes: Positioning configuration of the installed DynaLogger. By clicking on the question mark, an image will be displayed showing the DynaLogger X, Y and Z axes orientation. This orientation is also displayed on the device label. Based on this, the user can select the actual positioning given to the DynaLogger on the machine for each of the three axes. If you have any doubts about this subject, please refer to the section for Positioning of the sensor.

Once the spot settings have been completed, the changes can be saved by clicking “SAVE” located in the top right-hand corner. A summary of the settings will then be shown for confirmation.