9.5) Waveform autocorrelation
Autocorrelation is an analysis in the time domain that correlates waveforms with themselves to calculate a correlation factor at each time instant. It can be useful in helping the vibration analyst identify periodic frequencies, improving visualization and also, analogous to the previous section, allowing it to be displayed in its circular form.
To activate the waveform autocorrelation plot, simply, in the desired spectral screen, activate the option “![]() ” located in the upper part of the screen.
” located in the upper part of the screen.

Figure: Activation of autocorrelation
The graph will be displayed just above the spectrum. The same tools available for the standart waveform are also available.
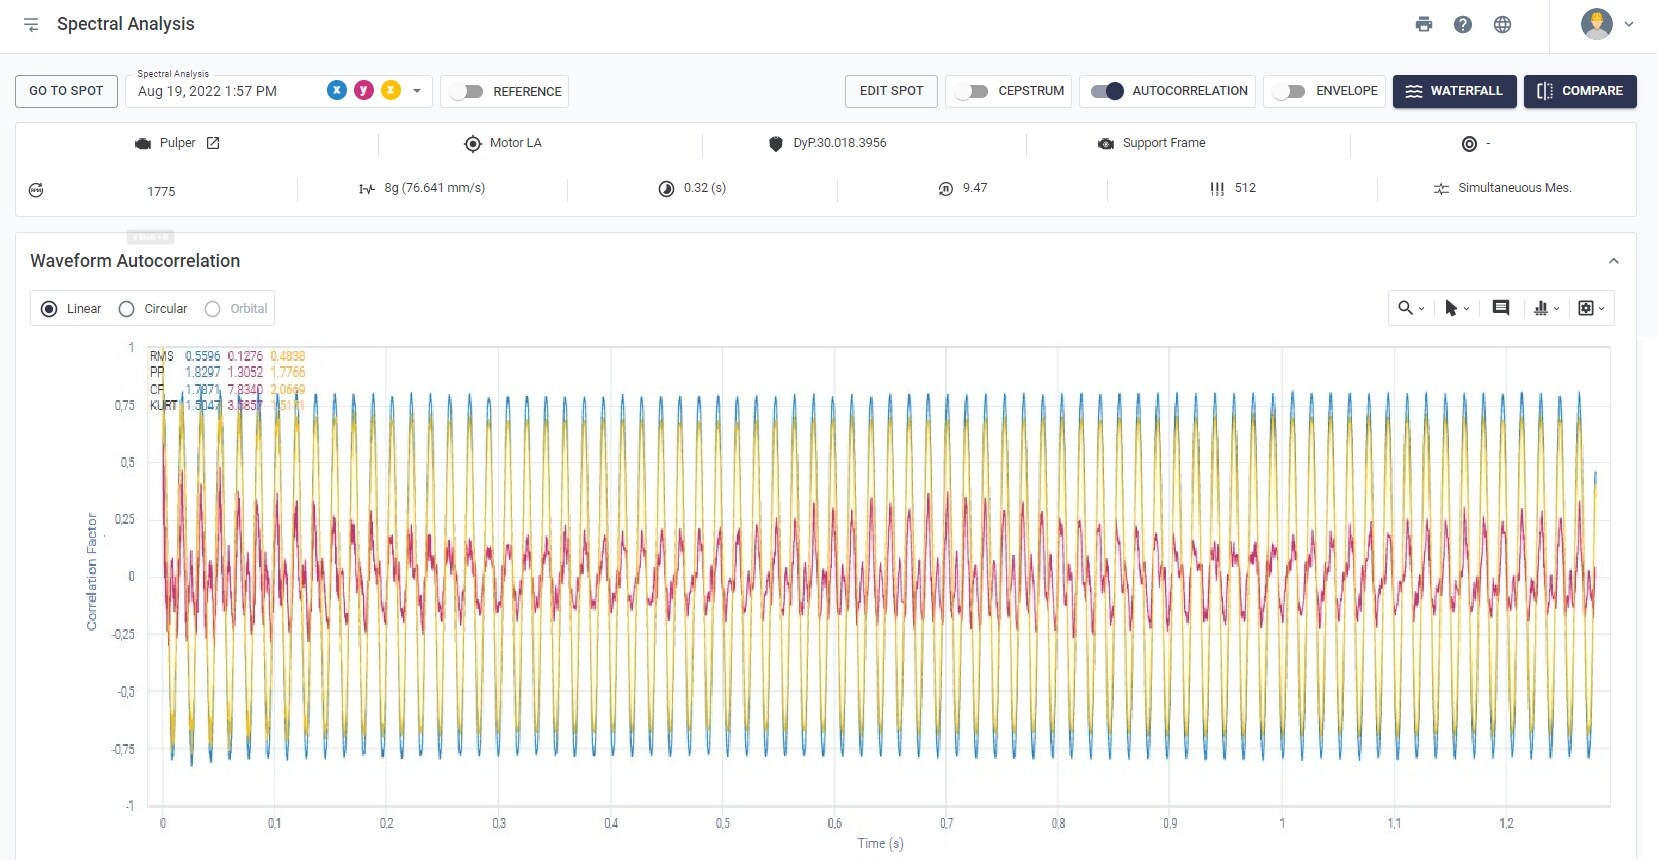
Figure: Waveform Autocorrelation