WEB: March/2025
The new update of the DynaPredict Web Platform is now available, full of exciting new features made especially for you! 

The latest updatebrings enhancements to Asset Tree Download, Report Creation, Geolocation Map, Bulk Visualization Editing, A2 Alert Emails, and Spectral Collection.
 Asset Tree Download
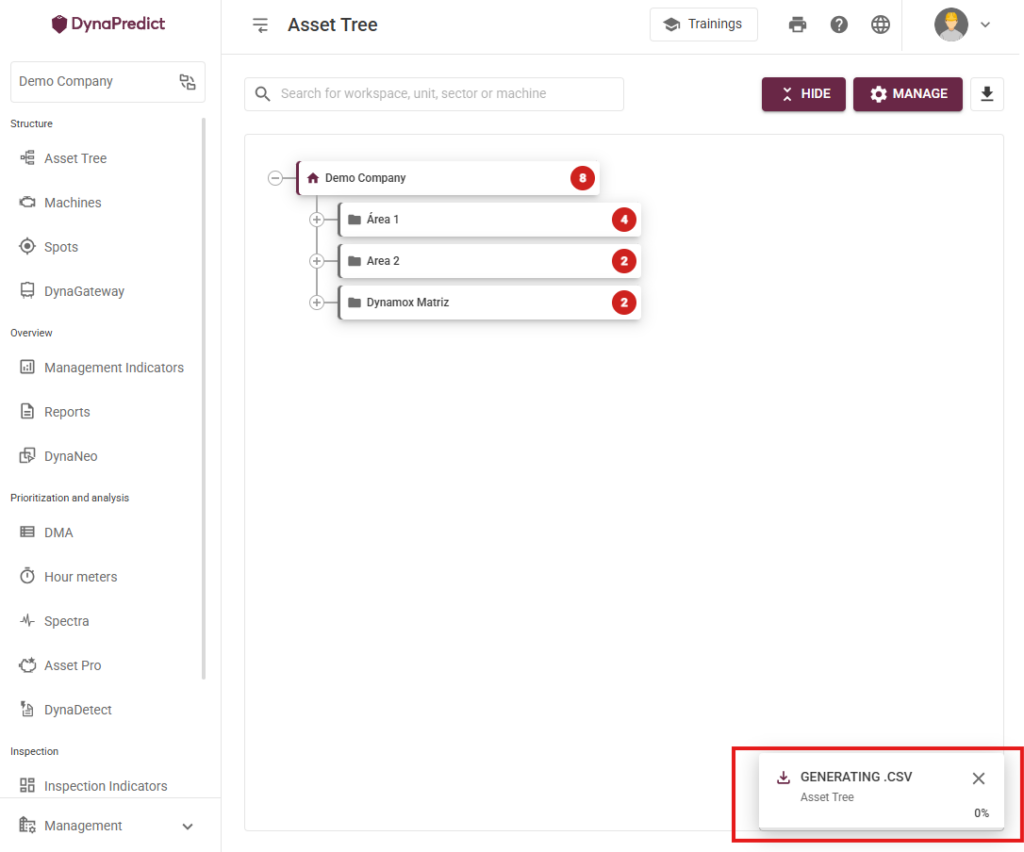
With the new update, users can now export the asset tree as a .CSV file directly from the platform! 
This tool allows the export of all information present in the asset tree, from the root folder to the spot level. The feature can be found in the upper right corner of the screen, as shown in the image below:
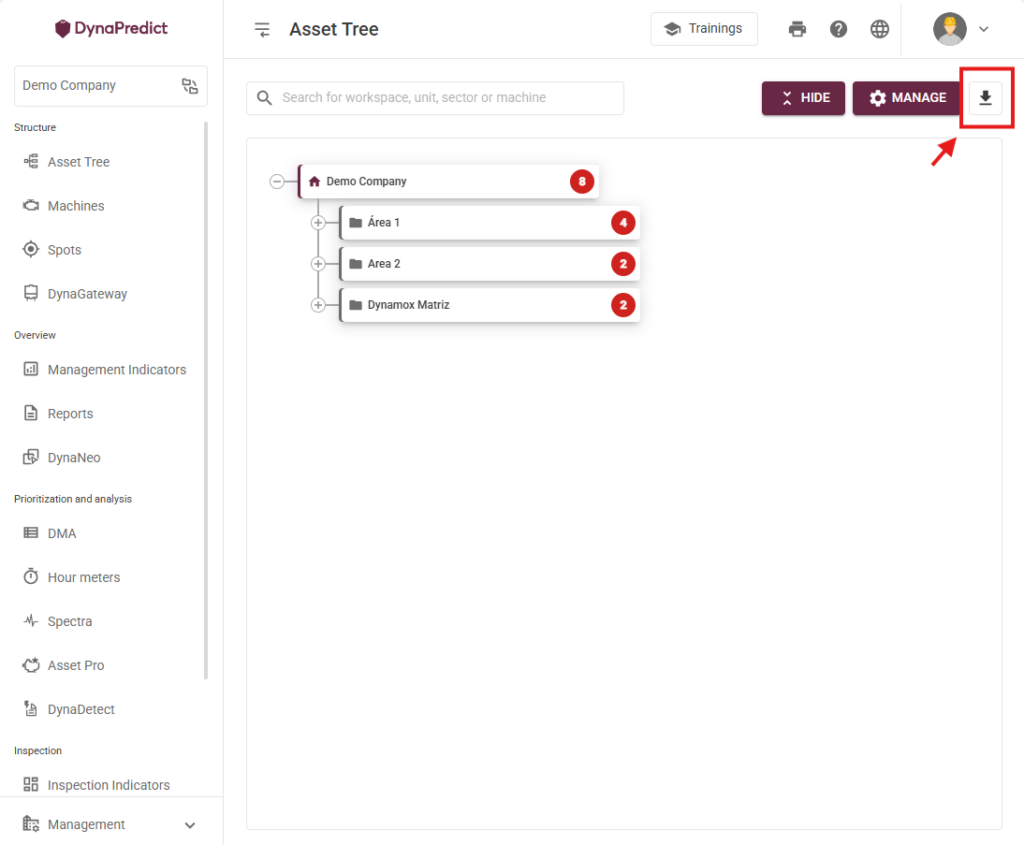
The .CSV file contains information from the root folder, subareas, machines, subsets, components, all the way to the spot. If the user is accessing a subarea, the download will export information starting from that subarea onward.
New Features in Report Creation
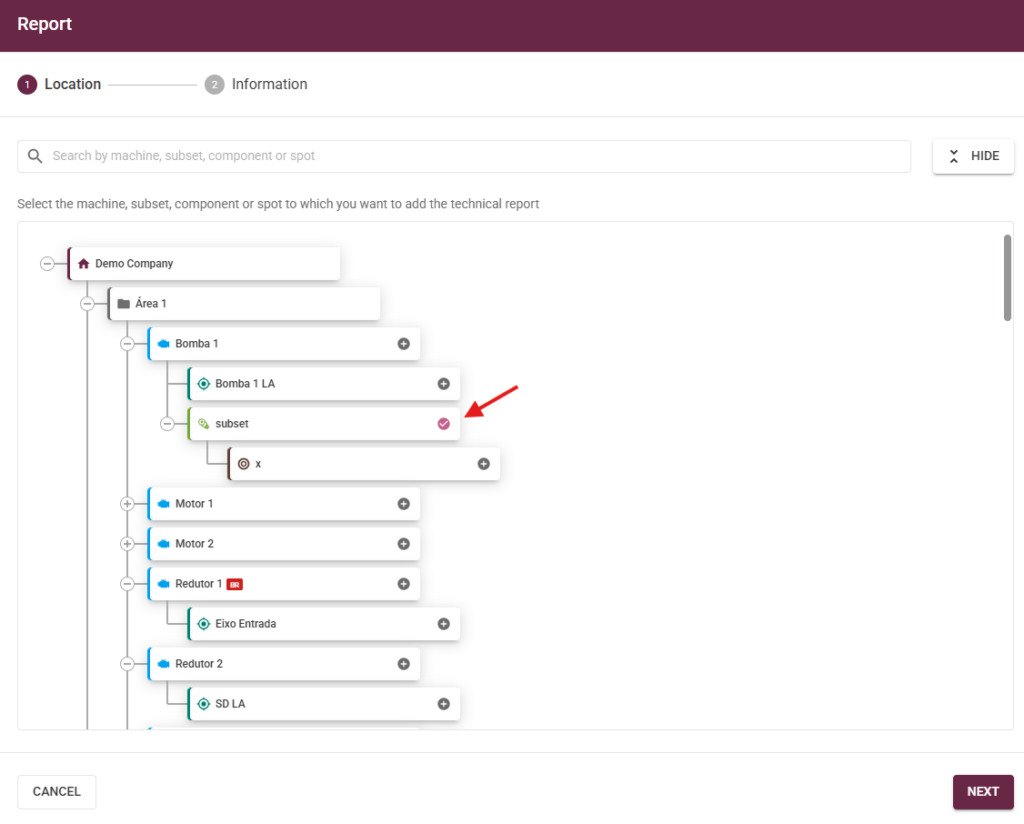
Historically, report creation was tied to specifying a report for an associated spot. With the new update, reports can now be created at different levels of the asset tree —such as machine, subset, component, or spot — allowing users to choose the most appropriate level for linking the report. 
Where can I access the new feature?
The report creation button, “+REPORT,” will be available on the following screens:
- Asset Pro
- Cascade
- Report Dashboard
- DynaDetect
- Machine Viewer
- Checklist Report
- Spot Viewer
- Spectral Viewer
 Ability to Paste/Drag and Drop Images
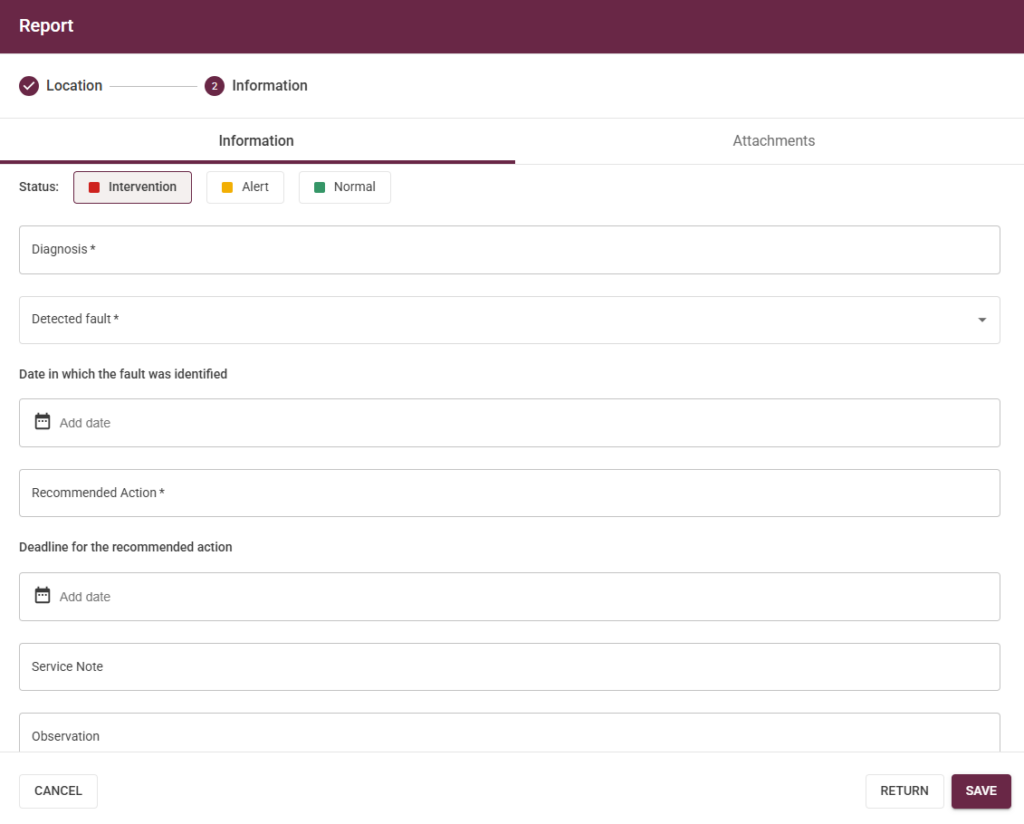
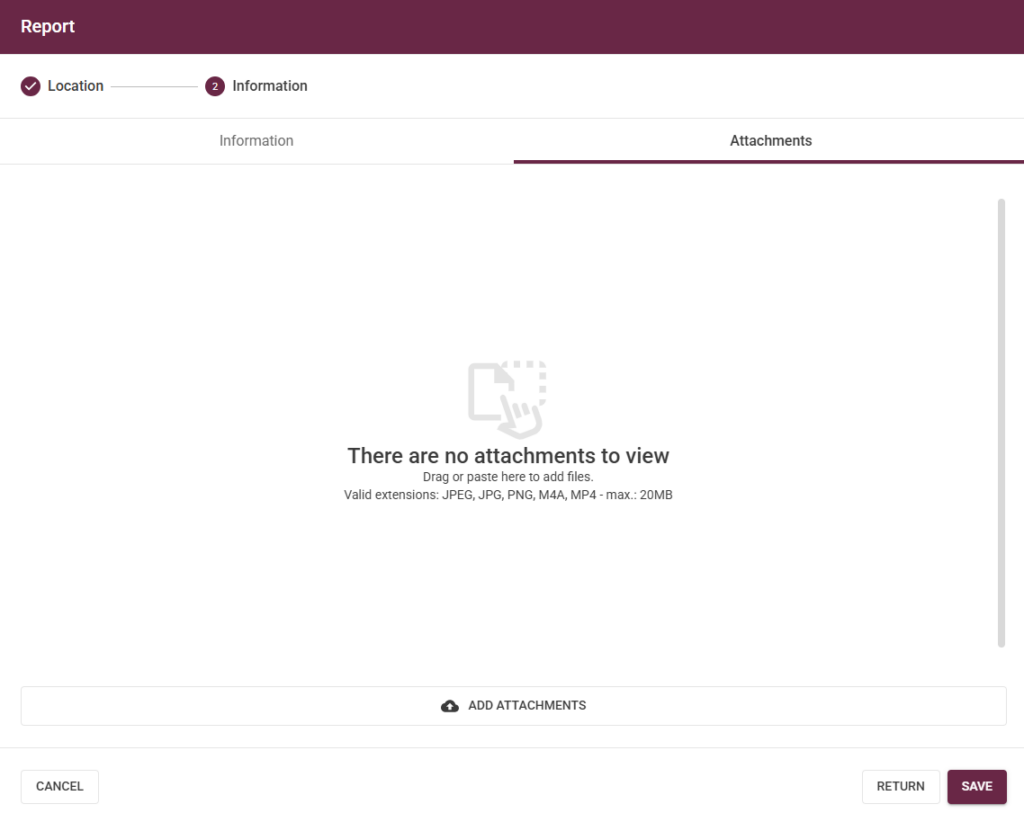
In addition to the detailed information provided, it is now possible to add attachments that complement the content of the report through the attachments sub-tab. 
It’s worth noting that users can drag and drop image files into the upload area of the attachments tab and/or paste images from the clipboard using CTRL+V.
Map with Geolocation
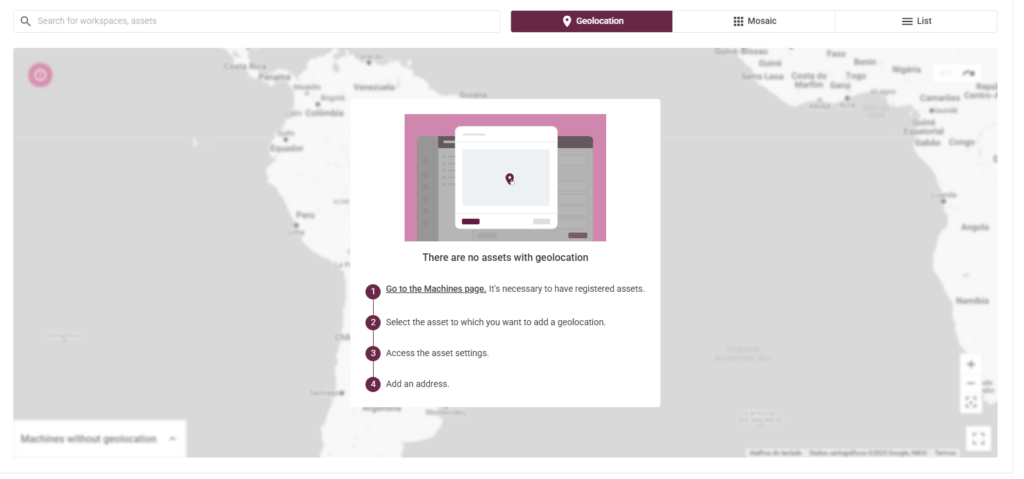
Expanding on the existing area health visualization formats, the update introduces the new “Geolocation Map”. 
This feature takes into account the location assigned to the machines within a given Workspace, calculating an average location based on all machines that belong to it.
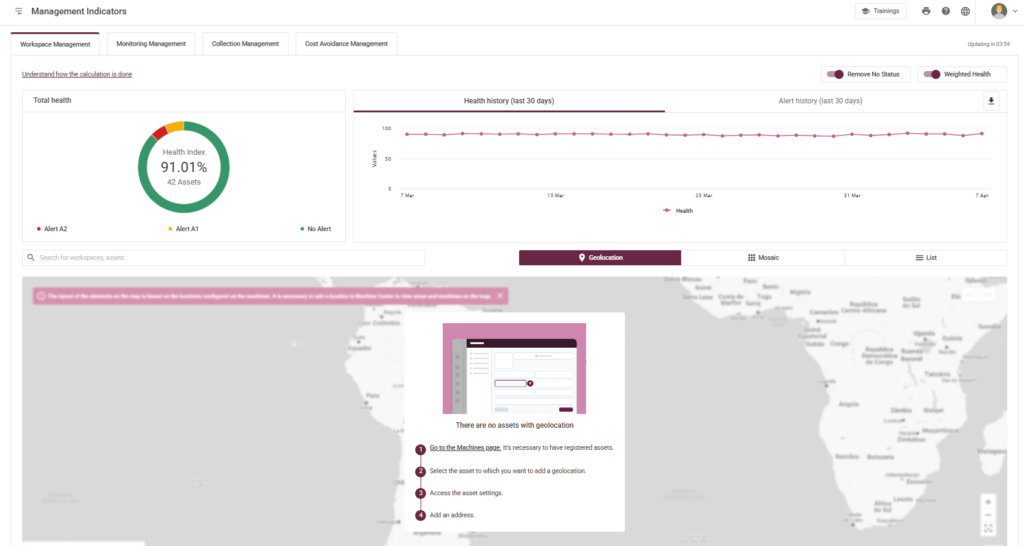
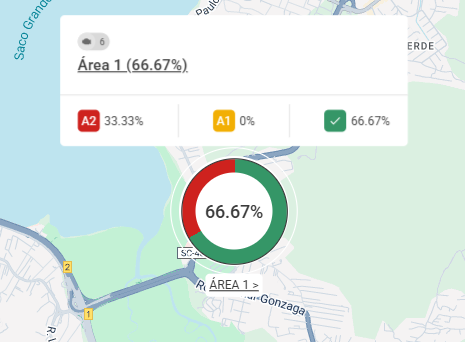
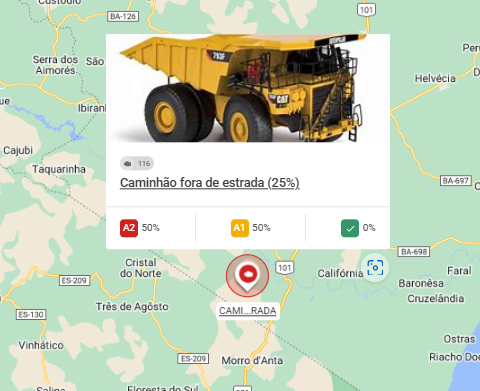
The map displays area-specific information such as overall health percentage, allowing users to view the percentage of A1 and A2 alerts, as well as the total number of machines.
If an area does not have any machines with registered geolocation, the user will receive guidance on how to proceed with the registration, along with a link directing them to the machine list.
Bulk Editing of Visualization Settings: Spot Viewer and Envelope
To make the spot editing process more efficient for users, the new update enables bulk editing of visualization settings for Spot Viewer and Envelope in the Web Platform! This tool is available for users with “Administrator” and “Editor” access levels. 
Which parameters can I configure?
At this stage, the parameters that can be configured in bulk are:
- RPM
- Default Spectral
- Bearings
- Visualization Preferences
- Spot Viewer
- Envelope
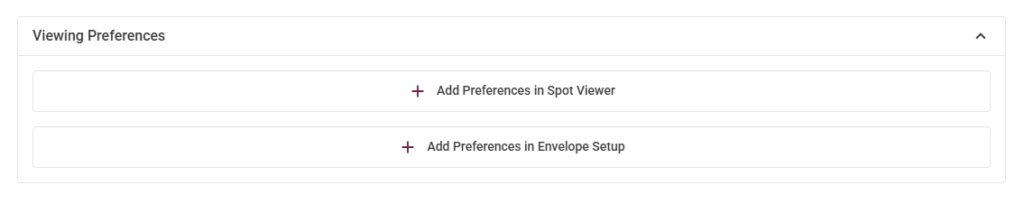
How to use the bulk configuration?
You can edit the visualization preferences for Spot Viewer and Envelope by adding the desired settings through the buttons shown in the image below:
Change in A2 Alert Email Notification Rules
The update introduces changes for users in the “Subscribers” category, who will now receive alert emails under the following conditions:
Immediate Notification: The user will always receive an email immediately after a metric changes to A2 for the first time (from A0 to A2 or A1 to A2). 
Resend After 24 Hours: If the metric remains at A2, a new email will be sent 24 hours after the initial notification. 
Spectral Collection Requirement Editing in Routes
With the new update, the platform now allows the spectral requirement to be configured individually per route!
How to enable individual route configuration
The user must open the Web Platform, log in, and access the Create Route page. When configuring a route that contains spots, the user will have the option to set the spectral collection requirement.
Start using the new updates now – already available on the Web Platform! 