WEB: August/2024
The new version of the DynaPredict Web Platform is now available. Check out the main features you can explore.
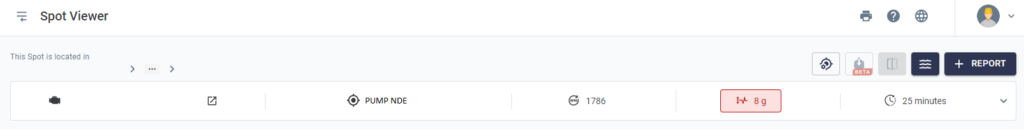
- Identification of Clipped Waveform in Spot Viewer
Now, when analyzing the Spot Viewer screen, you can see when collections are occurring with the dynamic range above what is configured. This information is presented with a red indicator showing the current dynamic range value. In these cases, we recommend increasing the collection range, and once new collections occur, the spot will have the dynamic range indicator updated without the red color.
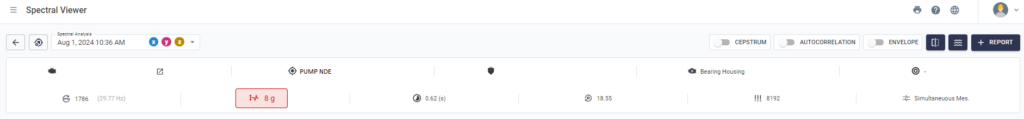
You can also check which collections had values above the configured range. To do this, open the spectral and, on the Spectral Viewer screen, see if the same red indicator is present. This way, you know which spectrals have all the necessary information for analysis, without clipped waveform.
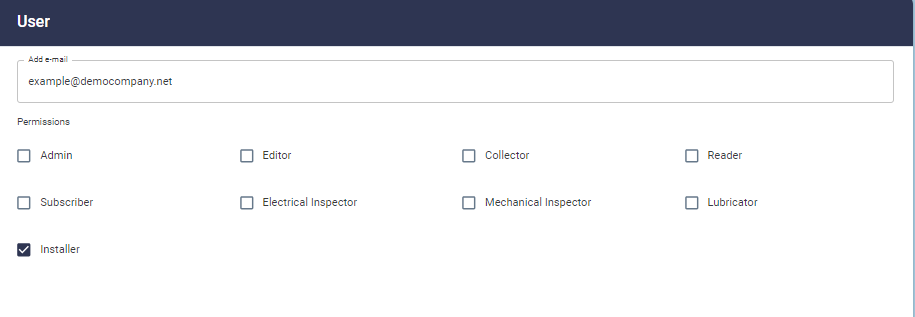
- New Profile: INSTALLER
You can select the new profile while creating or editing users on the Web Platform. It is an option that retains only the exclusive permissions for the collaborator who goes to the field to install the sensors.
That is, by selecting this profile, the person will be able to: edit axes, associate another sensor (of the same model), restart the sensor, and view sensor data in the app (but cannot delete data, perform collections, or sync with the Web Platform).